
Page 5 - Tranchina_alli_2004
P. 5
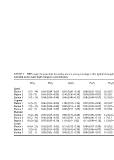
TABLE I XRF major elements data for sediments as a mass percentage in the hydrated samples
collected at the same depth (ranges in parentheses).

              SiO2    TiO2  Al2O3  P2O5  Fe2O3

Egadi       8 (2–14)  0.05 (0.04–0.05) 0.65 (0.60–0.70) 0.06 (0.03–0.07) 0.2 (0.2–
Station 1   3 (1–7)   0.04 (0.03–0.04) 0.44 (0.36–0.49) 0.05 (0.03–0.07) 0.2 (0.1–
Station 2   5 (1–11)  0.04 (0.04–0.04) 0.46 (0.40–0.53) 0.06 (0.04–0.07) 0.3 (0.2–
Station 3
Trapani     6 (5–7)   0.06 (0.04–0.08) 1.00 (0.57–1.36) 0.07 (0.05–0.08) 0.8 (0.7–
Station 1   5 (1–11)  0.06 (0.04–0.08) 0.80 (0.51–1.14) 0.05 (0.03–0.07) 0.9 (0.5–
Station 2   4 (1–7)   0.06 (0.04–0.07) 0.90 (0.53–1.05) 0.06 (0.05–0.07) 0.7 (0.4–
Station 3
Marsala     8 (2–16)  0.06 (0.05–0.07) 0.80 (0.73–0.86) 0.07 (0.06–0.07) 1.2 (2.0–
Station 1  10 (2–23)  0.06 (0.04–0.07) 0.81 (0.50–1.11) 0.09 (0.08–0.11) 1.7 (1.1–
Station 2  10 (2–22)  0.07 (0.05–0.10) 1.01 (0.6–1.52) 0.11 (0.09–0.12) 1.5 (0.9–
Station 3
Carini     10 (4–21)  0.02 (0.02–0.02) 0.31 (0.32–0.30) 0.08 (0.07–0.08) 0.3 (0.2–
Station 1   3 (2–4)   0.02 (0.01–0.02) 0.35 (0.41–0.29) 0.07 (0.06–0.07) 0.4 (0.3–
Station 2   2 (1–3)   0.02 (0.02–0.02) 0.42 (0.37–0.50) 0.06 (0.06–0.07) 0.3 (0.2–
Station 3