
Page 7 - Tranchina_alli_2004
P. 7
208 L. TRANCHINA et al.
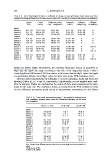
TABLE II XRD mineralogical features of sediments are shown as mass percentage: mean values over three
samples from different transects in the same site (see main text), collected at the same depth (ranges in parentheses).
Quartz Calcite Magnesian calcite Aragonite Dolomite Feldspar
SiO2 CaCO3 Ca(1 2 x)Mg(x)CO3
CaCO3 CaMg(CO3)2 (K,Na)Si3O8
Egadi 8 (1–15) 21 (17–22) 23 (2–42) 16 (1–27) 32 (2–72) 0
Station 1 3 (1–7) 22 (14–35) 37 (5–63) 17 (4–27) 21 (2–55) 0
Station 2 5 (0–16) 22 (6–38) 35 (14–63) 22 (9–31) 16 (9–39) 0
Station 3
Trapani 5 (4–6) 34 (17–50) 38 (29–48) 23 (13– 29) 0 0
Station 1 4 (0–12) 23 (19–24) 48 (25–67) 25 (14– 39) 0 0
Station 2 3 (0–6) 26 (10–47) 48 (28–71) 23 (19– 30) 0 0
Station 3
Marsala 6 (1–15) 23 (13–34) 45 (31–57) 25 (18– 29) 0 1 (0–1)
Station 1 7 (1–22) 26 (9–36) 45 (28–68) 22 (13– 27) 0 0
Station 2 7 (1–20) 20 (11–25) 49 (30–62) 23 (20– 06) 0
Station 3 1 (0–3)
Carini 13 (4–21) 28 (18–38) 29 (28–32) 18 (14– 21) 12 (9–15)
Station 1 3 (2–4) 19 (27–11) 56 (47–66) 20 (18– 21) 2 (1–3) 0
Station 2 2 (1–3) 8 (0–14) 53 (35–62) 34 (24– 45) 2 (1–4) 0
Station 3 1 (0–2)
Miller and Miller, 2000). Nevertheless, the dolomitic lithologies induce an increment of
MgO (see the Egadi site data), according to the role of the magnesian calcite. Fisher’s
Least Significant Difference (LSD) test shows, in this case, that the MgO values for Egadi
are statistically different from MgO values for other sites, at the 95% confidence level.
The trace metal concentrations in sediments, P. oceanica rhizomes, scales and leaves are
shown in Tables III, IV, V and VI, respectively. Unfortunately, no root samples were avail-
able for analysis. Values are expressed as the means of three pooled samples at the same
depth for the same site. The confidence limits, as arising from the 95% confidence limits
for the calibration parameters (main source of measurement uncertainty) are also shown
TABLE III Trace-metal concentrations (mg g21 dry weight) in sediments and
95% confidence (mainly arising from the calibration procedure; see the main
text for details).
Cu (13.3 + 2.7)Ã Pb (8 – 20)† Zn (10 – 40)†
Egadi 3.9 + 0.4 8+1 38 + 6
Station 1 4.3 + 0.4 6+1 43 + 7
Station 2 4.6 + 0.5 8+1 25 + 3
Station 3
Trapani 4.1 + 0.4 6.0 + 0.9 18 + 3
Station 1 9.0 + 0.8 5.3 + 0.9 20 + 2
Station 2 3.8 + 0.3 10 + 2 23 + 4
Station 3
Marsala 2.7 + 0.3 6.9 + 0.9 24 + 4
Station 1 2.7 + 0.3 10 + 1 32 + 3
Station 2 2.6 + 0.3 8+1 22 + 3
Station 3
Carini 2.0 + 0.2 6.9 + 0.9 12 + 2
Station 1 2.2 + 0.2 8.2 + 0.9 13 + 2
Station 2 2.4 + 0.2 10 + 1 20 + 4
Station 3
Note: Samples from different transects collected at the same depth have been analysed as a
whole.
ÃPergent et al. (1999).
†Sanchiz et al. (2000).