
Page 8 - Tranchina_alli_2004
P. 8
CHEMISTRY, MINERALOGY AND RADIOACTIVITY IN POSIDONIA OCEANICA 209
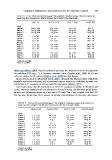
TABLE IV Trace-metal concentrations (mg g21 dry weight) in Posidonia oceanica rhizomes (values are
means over three samples from different transects and collected at the same depth).
Cd (1– 2)Ã Cu (5.4– 15.3)† Pb (2.5– 8.0)Ã Zn (40– 80)Ã
Egadi 0.60 + 0.07 12.6 + 0.6 2.4 + 0.2 82 + 9
Station 1 0.67 + 0.08 11.8 + 0.7 2.5 + 0.3 100 + 10
Station 2 0.57 + 0.08 4.5 + 0.4 110 + 20
Station 3 7.5 + 0.4
Trapani 1.8 + 0.2 4.6 + 0.5 80 + 10
Station 1 1.3 + 0.2 13.0 + 0.8 4.2 + 0.5 150 + 20
Station 2 1.2 + 0.2 11 + 1 3.9 + 0.4 110 + 10
Station 3 6.1 + 0.5
Marsala 1.7 + 0.3 4.3 + 0.5 290 + 40
Station 1 1.5 + 0.2 9.9 + 0.8 3.9 + 0.4 170 + 30
Station 2 1.8 + 0.2 7.3 + 0.8 4.6 + 0.4 310 + 40
Station 3 7.5 + 0.9
Carini 2.0 + 0.3 6.4 + 0.5 110 + 20
Station 1 2.3 + 0.4 9.7 + 0.4 11 + 1 90 + 20
Station 2 1.8 + 0.2 9.2 + 0.2 8.1 + 0.7 90 + 20
Station 3 11.3 + 0.4
ÃSanchiz et al. (2000).
†Baroli et al. (2001).
(Miller and Miller, 2000). Data for sediments are under the detection limit of our equipment
for cadmium (0.25 mg g21). A literature reference value (Pergent et al., 1999) for Cu and
reference ranges for Pb and Zn (Sanchiz et al., 2000) are also shown.
Many factors, such as differential metal uptake, chemical and physical water conditions,
seawater nutrients and ligands, and interactions between metals can contribute to metal con-
centrations in P. oceanica, as already noted for aluminum (Malea, 1993).
Our results show that the distribution of Cd in P. oceanica is similar in rhizomes and
scales, while the highest level was obtained in leaves in every site (between group homo-
geneity and differences tested by F-test and LSD test). The F-test coupled with the LSD
test has also shown that Cu is present in similar concentrations in rhizomes and leaves,
TABLE V Trace-metal concentrations (mg g21 dry weight) in Posidonia oceanica scales (values are
means over three samples from different transects and collected at the same depth).
Cd (0.6– 2.0)Ã Cu (6.0–17.0)Ã Pb (5.2– 11.2)Ã Zn (22.9–60.4)†
Egadi 1.4 + 0.2 6.6 + 0.8 9.1 + 0.9 100 + 10
Station 1 1.7 + 0.3 5.7 + 0.5 8.3 + 0.9 230 + 40
Station 2 1.7 + 0.3 7.7 + 0.9 230 + 30
Station 3 5+1
Trapani 1.2 + 0.1 9.5 + 0.8 250 + 40
Station 1 0.8 + 0.1 7+1 7.9 + 0.7 240 + 40
Station 2 1.2 + 0.2 6.1 + 0.9 10 + 1 280 + 30
Station 3 4.7 + 0.7
Marsala 1.6 + 0.2 7.8 + 0.8 500 + 100
Station 1 1.5 + 0.2 4.2 + 0.8 8.2 + 0.9 290 + 40
Station 2 2.2 + 0.4 3.7 + 0.7 7.5 + 0.9 350 + 40
Station 3
Carini 1.5 + 0.2 4+1 10.8 + 0.8 80 + 10
Station 1 1.5 + 0.2 9.0 + 0.9 80 + 20
Station 2 1.8 + 0.3 6.5 + 0.8 12 + 1 90 + 10
Station 3 7+1
7+1
ÃBaroli et al. (2001).
†Pergent et al. (1999).