
Page 5 - Antonellini_2013
P. 5
M. Antonellini et al. / Marine and Petroleum Geology xxx (2013) 1e16 5
down the computation time but it will strongly limit the structural
and lithologic detail that may be implemented in the reservoir/
aquifer model as well as the possibility of describing the small-scale
flow field. In a flow model, the hydraulic properties of the rock are
defined at each cell (or node), and include the permeability tensor k
and the effective porosity of the rock n e . The cell size, in this work,
has been kept small (0.2 m) to allow for a good description of the
reservoir/aquifer structural characteristics. The zones I, II and III
pertaining to the structures studied in outcrops have a thickness
that ranges from one mm to a few centimeters. The portable mini-
3
permeameter can sample a small volume of rock (1e2cm ), and the
measured permeability values are representative only for such a
small volume. It is therefore important to up-scale the permeability
measured in the field to the cell size of the volume. A procedure
similar to that presented by Antonellini and Aydin (1994, 1995) and
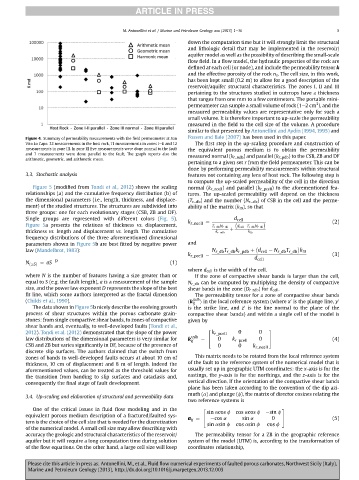
Figure 4. Summary of permeability measurements with the field permeameter at San Fossen and Bale (2007) has been used in this paper.
Vito Lo Capo. 33 measurements in the host rock, 11 measurements in zones IeII and 12 The first step in the up-scaling procedure and construction of
measurements in zone III. In zone III five measurements were done normal to the fault the equivalent porous medium is to obtain the permeability
and 7 measurements were done parallel to the fault. The graph reports also the measured normal (k r_ndb ) and parallel (k r_pdb ) to the CSB, ZB and DF
arithmetic, geometric, and arithmetic mean.
pertaining to a given set r from the field permeameter. This can be
done by performing permeability measurements within structural
3.3. Stochastic analysis features not containing any lens of host rock. The following step is
to compute the up-scaled permeability of the cell in the direction
Figure 5 (modified from Tondi et al., 2012) shows the scaling normal (k r_ncell ) and parallel (k r_pcell ) to the aforementioned fea-
relationships (a) and the cumulative frequency distribution (b) of tures. The up-scaled permeability will depend on the thickness
the dimensional parameters (i.e., length, thickness, and displace- (T r _ db ) and the number (N r _ db ) of CSB in the cell and the perme-
ment) of the studied structures. The structures are subdivided into ability of the matrix (k m ), so that
three groups: one for each evolutionary stages (CSB, ZB and DF).
Single groups are represented with different colors (Fig. 5). d cell
k r_ncell ¼ (2)
Figure 5a presents the relations of thickness vs. displacement, T r_db N r_db d cell T r_db N r_db
thickness vs. length and displacement vs. length. The cumulative k r_ndb þ k m
frequency distributions of the three aforementioned dimensional
parameters shown in Figure 5b are best fitted by negative power and
T
T
k
law (Mandelbrot, 1983): N r_db r_db r_pdb þ d cell N r_db r_db k m
k r_pcell ¼ (3)
d cell
N ð SÞ ¼ aS D (1)
where d cell is the width of the cell.
where N is the number of features having a size greater than or If the zone of compactive shear bands is larger than the cell,
equal to S (e.g. the fault length), a is a measurement of the sample N r_db can be computed by multiplying the density of compactive
size, and the power law exponent D represents the slope of the best shear bands in the zone (D r zdb ) for d cell .
fit line, which some authors interpreted as the fractal dimension The permeability tensor for a zone of compactive shear bands
(Childs et al., 1990). ðk 0zdb Þ in the local reference system (where x is the plunge line, y 0
0
ij
The data shown in Figure 5b nicely describe the evolving growth is the strike line, and z is the line normal to the plane of the
0
process of shear structures within the porous carbonate grain- compactive shear bands) and within a single cell of the model is
stones: from single compactive shear bands, to zones of compactive given by
shear bands and, eventually, to well-developed faults (Tondi et al.,
2012). Tondi et al. (2012) demonstrated that the slope of the power 2 k r_pcell 0 0 3
law distributions of the dimensional parameters is very similar for k 0zdb 0 k 0 5 (4)
ij ¼ 4 r_pcell
CSB and ZB but varies significantly in DF, because of the presence of 0 0 k r_ncell
discrete slip surfaces. The authors claimed that the switch from
zones of bands to well-developed faults occurs at about 10 cm of This matrix needs to be rotated from the local reference system
thickness, 10 cm of displacement and 8 m of length. Indeed the of the fault to the reference system of the numerical model that is
aforementioned values, can be treated as the threshold values for usually set up in geographic UTM coordinates: the x-axis is for the
the transition from banding to slip surfaces and cataclasis and, eastings, the y-axis is for the northings, and the z-axis is for the
consequently the final stage of fault development. vertical direction. If the orientation of the compactive shear bands
plane has been taken according to the convention of the dip azi-
muth (a) and plunge (f), the matrix of director cosines relating the
3.4. Up-scaling and elaboration of structural and permeability data
two reference systems is
One of the critical issues in fluid flow modeling and in the 2 sin acos f cos acos f sin f 3
equivalent porous medium description of a fractured/faulted sys-
a ij ¼ 4 cos a sin a 0 5 (5)
tem is the choice of the cell size that is needed for the discretization sin asin f cos asin f cos f
of the numerical model. A small cell size may allow describing with
accuracy the geologic and structural characteristics of the reservoir/ The permeability tensor for a ZB in the geographic reference
aquifer but it will require a long computation time during solution system of the model (UTM) is, according to the transformation of
of the flow equations. On the other hand, a large cell size will keep coordinates relationship,
Please cite this article in press as: Antonellini, M., et al., Fluid flow numerical experiments of faulted porous carbonates, Northwest Sicily (Italy),
Marine and Petroleum Geology (2013), http://dx.doi.org/10.1016/j.marpetgeo.2013.12.003