
Page 9 - Antonellini_2013
P. 9
M. Antonellini et al. / Marine and Petroleum Geology xxx (2013) 1e16 9
Table 2
P 32 values obtained including the P 10 from Table 1 in the equations of the linear intercepts shown in Figure 6.
Well 1 Well2 Well 3 Well 4 Well 5 Well 6 Mean
CSB 0.06804 0.012892 0.616169 0.11611 0.056843 0.05934 0.154899
ZB 0.298714 0.00466 0.054789 0.126065 0.113676 0.117188 0.142086
DF 0.415522 0.102995 0.09995 0.02302 0.073632 0.375007 0.241789
The map consists of a series of objects such as polylines and poly- 3.7. Fluid flow numerical experiment
gons representing the different zones present within single struc-
tures. The permeability tensor of these objects (measured in the The fluid flow numerical experiments have been done using
field in zones I, II and III see Section 3.2) and up-scaled with the MODFLOW 2005 (Harbaugh, 2005), which is a widely used modular
methodology explained in Section 3.4 has been transformed in a single-phase ground water flow simulator.
hydraulic conductivity tensor (K) for compliance with the re- In order to evaluate the effects of the SSRF made up by CSB, ZB
quirements of MODFLOW 2005 (Harbaugh, 2005). The hydraulic and DF on fluid flow, we have run some simple single-phase steady-
conductivity K (three components) of the polylines and polygons
has been rotated using Eqs. (6) and (10) from the local reference
system (faults) to the geographic reference system of the model.
The map with its attributes has been saved as a shape file in
ArcGisÔ.
The shape file has been loaded into ModelMuse (Winston, 2009)
(Fig. 9a). ModelMuse is a graphical user interface (GUI) developed
at the United States Geological Survey (USGS) for programs PHAST
and MODFLOW 2005 (Harbaugh, 2005; Parkhurst et al., 2010) (see
Section 3.7). The advantage of loading the shape file with its at-
tributes directly into ModelMuse is that the hydraulic conductivity
(K) in the components x, y and z of the different polygons and
polylines representing compactive shear bands, zones of compac-
tive shear bands and fault discontinuities is automatically loaded as
datasets of the hydraulic properties without the need of manually
inserting the K values for each object.
The detailed geologic, structural, and permeability information
obtained from the measurements and field maps (Fig. 3) is used in
the reservoir/aquifer model by means of up-scaled hydraulic con-
ductivity distribution maps. Figure 10a shows the conductivity
distribution map of the deterministic model whereas Figure 10b
shows the same map for the DFN one.
Figure 7. DFN model of the S. Vito lo Capo map in Fig. 3a. Left-lateral CSB (lime green);
right-lateral CSB (red); left-lateral ZB (blue); right-lateral ZB (dark green); left-lateral
DF (brown); right-lateral DF (yellow). (For interpretation of the references to color in
this figure legend, the reader is referred to the web version of this article.)
Table 3
Attributes associated to the different structures.
Structure Attribute name Attribute value
Left-lateral CSB CSB 1
Right-lateral CSB CSB 2
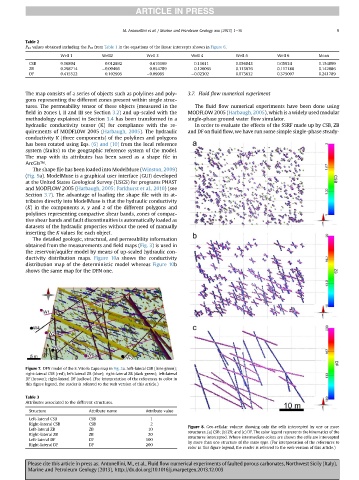
Figure 8. Geo-cellular volume showing only the cells intercepted by one or more
Left-lateral ZB ZB 10 structures. (a) CSB; (b) ZB; and (c) DF. The color legend represents the kinematics of the
Right-lateral ZB ZB 20
structures intercepted. Where intermediate colors are shown the cells are intercepted
Left-lateral DF DF 100
by more than one structure of the same type. (For interpretation of the references to
Right-lateral DF DF 200
color in this figure legend, the reader is referred to the web version of this article.)
Please cite this article in press as: Antonellini, M., et al., Fluid flow numerical experiments of faulted porous carbonates, Northwest Sicily (Italy),
Marine and Petroleum Geology (2013), http://dx.doi.org/10.1016/j.marpetgeo.2013.12.003