
Page 14 - Antonellini_2013
P. 14
14 M. Antonellini et al. / Marine and Petroleum Geology xxx (2013) 1e16
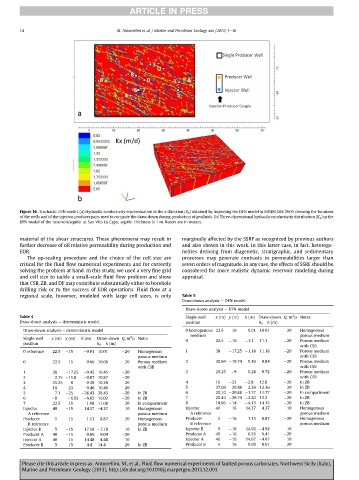
Figure 14. Stochastic DFN model. (a) Hydraulic conductivity representation in the x direction (K x ) obtained by importing the DFN model in MODFLOW 2005 showing the locations
of the wells and of the injector-producer pairs used to compute the draw-down during production of geofluids. (b) Three-dimensional hydraulic conductivity distribution (K x ) in the
DFN model of the reservoir/aquifer at San Vito Lo Capo; aquifer thickness is 1 m. Rulers are in meters.
material of the shear structures. These phenomena may result in marginally affected by the SSRF as recognized by previous authors
further decrease of oil relative permeability during production and and also shown in this work. In this latter case, in fact, heteroge-
EOR. neities deriving from diagenetic, stratigraphic, and sedimentary
The up-scaling procedure and the choice of the cell size are processes may generate contrasts in permeabilities larger than
critical for the fluid flow numerical experiments and for correctly seven orders of magnitude. In any case, the effects of SSRF should be
solving the problem at hand. In this study, we used a very fine grid considered for more realistic dynamic reservoir modeling during
and cell size to tackle a small-scale fluid flow problem and show appraisal.
that CSB, ZB, and DF may contribute substantially either to borehole
drilling risk or to the success of EOR operations. Fluid flow at a
regional scale, however, modeled with large cell sizes, is only Table 5
Draw-down analysis e DFN model.
Draw-down analysis e DFN model
3
Table 4 Single well x (m) y (m) h (m) Draw-down Q,m /s Notes
Draw-down analysis e deterministic model. position h 0 h (m)
Draw-down analysis e deterministic model 0 homogenous 22.5 16 0.01 10.01 20 Homogenous
medium porous medium
3
Single well x (m) y (m) h (m) Draw-down Q,m /s Notes 0 22.5 16 1.1 11.1 20 Porous medium
position h 0 h (m)
with CSB
0 reference 22.5 15 0.01 10.01 20 Homogenous 1 38 17.25 1.18 11.18 20 Porous medium
porous medium with CSB
0 22.5 15 0.66 10.66 20 Porous medium 2 30.94 10.74 0.16 9.84 20 Porous medium
with CSB with CSB
1 38 17.25 0.45 10.45 20 3 25.25 9 0.28 9.72 20 Porous medium
2 2.75 11.8 0.87 10.87 20 with CSB
3 25.25 9 0.39 10.39 20 4 16 23 2.8 12.8 20 In ZB
4 16 23 0.46 10.46 20 5 37.69 20.48 2.36 12.36 20 In ZB
5 7.1 25 28.43 38.43 20 In ZB 6 20.10 20.88 1.77 11.77 20 In compartment
6 8 6.02 6.02 16.02 20 In ZB 7 20.44 20.74 2.20 12.2 20 In ZB
7 22.5 15 1.08 11.08 20 In compartment 8 18.95 14 4.15 14.15 20 In ZB
Injector 40 15 14.37 4.37 10 Homogenous Injector 40 16 14.37 4.37 10 Homogenous
A reference porous medium A reference porous medium
Producer 5 15 1.13 8.87 20 Homogenous Producer 5 16 1.13 8.87 20 Homogenous
B reference porous medium B reference porous medium
Injector B 5 15 17.18 7.18 10 In ZB Injector B 5 16 14.92 4.92 10
Producer A 40 15 0.96 9.04 20 Producer A 40 16 0.59 9.41 20
Injector A 40 15 14.48 4.48 10 Injector A 40 16 14.67 4.67 10
Producer B 5 15 4.4 14.4 20 In ZB Producer B 5 16 0.09 9.91 20
Please cite this article in press as: Antonellini, M., et al., Fluid flow numerical experiments of faulted porous carbonates, Northwest Sicily (Italy),
Marine and Petroleum Geology (2013), http://dx.doi.org/10.1016/j.marpetgeo.2013.12.003