
Page 10 - Antonellini_2013
P. 10
10 M. Antonellini et al. / Marine and Petroleum Geology xxx (2013) 1e16
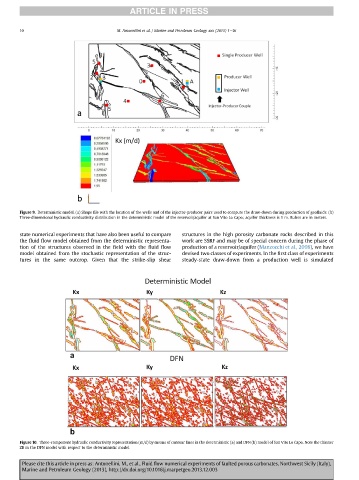
Figure 9. Deterministic model. (a) Shape file with the location of the wells and of the injector-producer pairs used to compute the draw-down during production of geofluids. (b)
Three-dimensional hydraulic conductivity distribution in the deterministic model of the reservoir/aquifer at San Vito Lo Capo; aquifer thickness is 1 m. Rulers are in meters.
state numerical experiments that have also been useful to compare structures in the high porosity carbonate rocks described in this
the fluid flow model obtained from the deterministic representa- work are SSRF and may be of special concern during the phase of
tion of the structures observed in the field with the fluid flow production of a reservoir/aquifer (Manzocchi et al., 2008), we have
model obtained from the stochastic representation of the struc- devised two classes of experiments. In the first class of experiments
tures in the same outcrop. Given that the strike-slip shear steady-state draw-down from a production well is simulated
Figure 10. Three-component hydraulic conductivity representation (m/d) by means of contour lines in the deterministic (a) and DFN (b) model of San Vito Lo Capo. Note the thinner
ZB in the DFN model with respect to the deterministic model.
Please cite this article in press as: Antonellini, M., et al., Fluid flow numerical experiments of faulted porous carbonates, Northwest Sicily (Italy),
Marine and Petroleum Geology (2013), http://dx.doi.org/10.1016/j.marpetgeo.2013.12.003