
Page 11 - Antonellini_2013
P. 11
M. Antonellini et al. / Marine and Petroleum Geology xxx (2013) 1e16 11
(Fig. 11aeb and 12), in the second class of experiments the flow 4. Results and discussion
field and the draw-down resulting from a pair of injector-producer
wells has been examined (Fig.13). This latter is a representation of a 4.1. Permeability
typical Enhanced Oil Recovery technique. The boundary conditions
are fixed at a constant head along the borders of the model (head The air permeability values obtained with the field per-
3
equal to 10 m) and steady injection (Q ¼ 10 m /d) and production meameter for the outcrop of San Vito Lo Capo at the positions
3
(Q ¼ 20 m /d) rates are imposed at the wells within the model shown in Figure 3a and b are summarized in Figure 4. The
(Figs.12 and 13). The thickness of the layer containing the faults has permeability difference between the host rock and the zones IeII,
been set to 1 m and two impermeable layers have been imposed at and III associated to the single structures is in the order of 3e4
the top and at the bottom of the model to simulate a confined orders of magnitude. The 33 air permeability measurements made
reservoir/aquifer. The locations of the wells used in the different in the host rock range from 0.18 to 87.9 Darcy with a 2.67 Darcy
numerical experiments are shown in Figures 9a and 14a. In all harmonic mean. The 12 air permeability measurements made in
classes of experiments a reference state (Figs. 11a, 12a and 13a) is zone III of the faults (in a direction normal to the fault plane) range
given in which no structures are present and the draw-down occurs from 0.033 to 0.803 Darcy with a 0.1 Darcy harmonic mean. In the
in an homogenous porous medium with the hydraulic character- same zone, the air permeability measurements carried out parallel
istics of the un-deformed carbonate rock (K matrix). In single well to the fault plane range from 0.053 to 0.104 Darcy with a
draw-down and in the injector-producer pair experiments all 0.087 Darcy harmonic mean (0.225 Darcy arithmetic mean). The 11
boundary conditions are the same and only the well position is parallel to the fault plane air permeability measurements of zones
varied within the model. IeII show values ranging from 0.024 to 1.863 Darcy, with a
0.091 Darcy harmonic mean (1.07 Darcy arithmetic mean). The
hydraulic conductivity difference drops down to 1e2 orders of
magnitude (Fig. 10) after up-scaling to a cell size of 0.2 m. The
reduction in permeability measured from the host rock to the CSB
and ZB is less pronounced (one order of magnitude) than what
measured in deformation bands within porous carbonate by Rath
et al. (2011) or in siliciclastic rocks (Antonellini and Aydin, 1994,
1995; Fossen and Bale, 2007).
4.2. Numerical experiments
A summary for the single-phase steady-state numerical exper-
iments performed is given in Table 4 for the deterministic model
and in Table 5 for the DFN model; these tables allow for easy
comparison of the well draw-downs in the different experimental
setups. In the deterministic models, the results of the single well
experiments show that the draw-down varies from 10.66 m (in the
un-deformed reference state) to 38.43 m (Table 4 and Fig. 12). The
draw-down in the deformed grainstone with shear structures can
increase up to a factor of 4 with respect to the un-deformed case;
furthermore the draw-down cone in the deformed grainstone can
be rather anisotropic (Figs. 11b and 12c) with respect to the un-
deformed situation (Figs. 11a and 12a). In the injector-producer
pair experiment, the draw-down varies from 4.37 (in the un-
deformed reference state) to 7.18 at the injector (negative sign
is for a rise in hydraulic head) and from 8.87 (in the un-deformed
reference state) to 14.4 for the producer well. The variation in
draw-down is obtained by swapping the position of the producer
and of the injector (Table 4 and Fig. 13). The largest absolute draw-
down values (16.02 and 38.43 m) are observed where the well is
placed within a DF or in a small, shear structures-bounded
compartment (Table 4 and Fig. 12cef). In the DFN models, the re-
sults of the single well experiments show that the draw-down
varies from 10.01 m (in the un-deformed reference state) to
14.15 m (Table 5 and Fig. 15). In the injector-producer pair experi-
ment, the draw-down varies from 4.37 (in the un-deformed
reference state) to 4.92 m at the injector (negative sign is for a
rise in hydraulic head) and from 9.41 (in the un-deformed reference
state) to 9.91 m for the producer well (Table 5).
In the models with the deterministic description of the reser-
voir/aquifer (Fig. 12), the draw-down may increase in a compart-
ment among shear structures 15e20% (Fig. 12e and f) and in a ZB or
DF up to 400% (Fig. 12c and d) with respect to the reference (un-
3
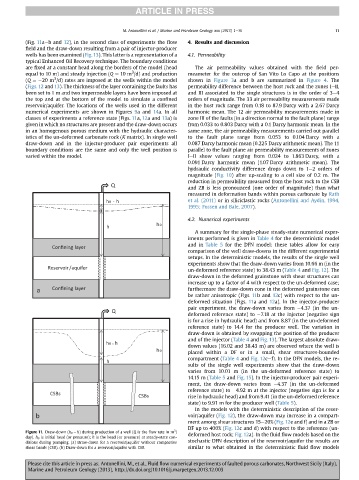
Figure 11. Draw-down (h 0 h) during production of a well (Q is the flow rate in m /
day). h 0 is initial head (or pressure); h is the head (or pressure) at steady-state con- deformed host rock; Fig. 12a). In the fluid flow models based on the
ditions during pumping. (a) Draw-down for a reservoir/aquifer without compactive stochastic DFN description of the reservoir/aquifer the results are
shear bands (CSB). (b) Draw-down for a reservoir/aquifer with CSB. similar to what obtained in the deterministic fluid flow models
Please cite this article in press as: Antonellini, M., et al., Fluid flow numerical experiments of faulted porous carbonates, Northwest Sicily (Italy),
Marine and Petroleum Geology (2013), http://dx.doi.org/10.1016/j.marpetgeo.2013.12.003