
Page 8 - EAI-4_2015_60-68
P. 8
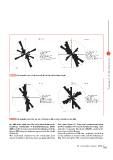
FIGURE 7 Discontinuities plot of Cala Azzurra (left) and Cala del Bue Marino (right)                                                               Research & development

FIGURE 8 Discontinuities plot of the two side of Cala Rossa (West on the left and Est on the right)

the cliffs in the study area. The comparison between the   than 1mm (Figure 10). Only eight measurement points
traditional classification of Beniawsky/Romana (RMR/       showed variations over the 24 months exceeding 1 mm
SMR) and the recent experimental classification of Sicily  and only 1 is greater than 5 mm (RE3M2, a joint in the
Region (SR) showed a moderate agreement in the results     central part of Cala Rossa).
(Figure 9).                                                From the preliminary GPS data, consisting in the first
The movements measured by the mechanical joint-            survey realised in October 2012 and the following of
meters installed in the three bays are generally lower     May 2013 and April 2014, some horizontal millimeter

                                                                                                     65EAI Energia, Ambiente e Innovazione 4/2015