
Page 5 - Falconi_et_al_2017
P. 5
126 L. Falconi et al.
divided into non-overlapping windows of 40 s and the Fast
Fourier Transform (FFT) was computed for each component
in the frequency range between 1.0 and 60.0 Hz. By aver-
aging over the windows, the amplitude spectra and the H/V
spectral ratio were finally achieved for each single record.
The HVSR method (Nakamura 1989) allows to obtain the
resonance frequency of a site. The presence of a resonance
peak in the HVSR curve has been interpreted both in terms
of SH-wave resonance and in terms of the ellipticity of
particle motion when the ambient noise wave train is made
up predominantly of surface waves (Bonnefoy-Claudet et al.
2006). The wavefield is a combination of both types and the
shape of the HVSR curve provides information about the
shear wave velocity profile in shallow sediments (Galea
et al. 2014).
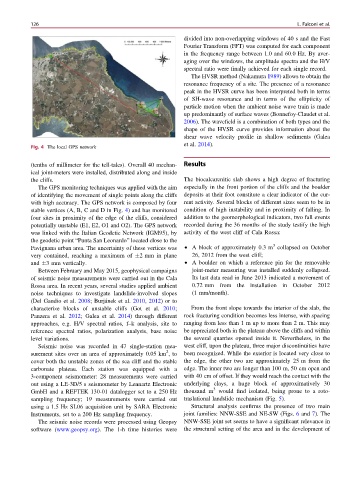
Fig. 4 The local GPS network
(tenths of millimeter for the tell-tales). Overall 40 mechan- Results
ical joint-meters were installed, distributed along and inside
the cliffs. The biocalcarenitic slab shows a high degree of fracturing
The GPS monitoring techniques was applied with the aim especially in the front portion of the cliffs and the boulder
of identifying the movement of single points along the cliffs deposits at their foot constitute a clear indicator of the cur-
with high accuracy. The GPS network is composed by four rent activity. Several blocks of different sizes seem to be in
stable vertices (A, B, C and D in Fig. 4) and has monitored condition of high instability and in proximity of falling. In
four sites in proximity of the edge of the cliffs, considered addition to the geomorphological indicators, two fall events
potentially unstable (E1, E2, O1 and O2). The GPS network recorded during the 36 months of the study testify the high
was linked with the Italian Geodetic Network (IGM95), by activity of the west cliff of Cala Rossa:
the geodetic point “Punta San Leonardo” located close to the
3
Favignana urban area. The uncertainty of these vertices was • A block of approximately 0.3 m collapsed on October
very contained, reaching a maximum of ±2 mm in plane 26, 2012 from the west cliff;
and ±3 mm vertically. • A boulder on which a reference pin for the removable
Between February and May 2015, geophysical campaigns joint-meter measuring was installed suddenly collapsed.
of seismic noise measurements were carried out in the Cala Its last data read in June 2013 indicated a movement of
Rossa area. In recent years, several studies applied ambient 0.72 mm from the installation in October 2012
noise techniques to investigate landslide-involved slopes (1 mm/month).
(Del Gaudio et al. 2008; Burjánek et al. 2010, 2012)or to
characterize blocks of unstable cliffs (Got et al. 2010; From the front slope towards the interior of the slab, the
Panzera et al. 2012; Galea et al. 2014) through different rock fracturing condition becomes less intense, with spacing
approaches, e.g. H/V spectral ratios, f–k analysis, site to ranging from less than 1 m up to more than 2 m. This may
reference spectral ratios, polarization analysis, base noise be appreciated both in the plateau above the cliffs and within
level variations. the several quarries opened inside it. Nevertheless, in the
Seismic noise was recorded in 47 single-station mea- west cliff, upon the plateau, three major discontinuities have
2
surement sites over an area of approximately 0.05 km ,to been recognized. While the exterior is located very close to
cover both the unstable zones of the sea cliff and the stable the edge, the other two are approximately 25 m from the
carbonate plateau. Each station was equipped with a edge. The inner two are longer than 100 m, 50 cm open and
3-component seismometer: 28 measurements were carried with 40 cm of offset. If they would reach the contact with the
out using a LE-3D/5 s seismometer by Lennartz Electronic underlying clays, a huge block of approximatively 30
3
GmbH and a REFTEK 130-01 datalogger set to a 250 Hz thousand m would find isolated, being prone to a roto-
sampling frequency; 19 measurements were carried out traslational landslide mechanism (Fig. 5).
using a 1.5 Hz SL06 acquisition unit by SARA Electronic Structural analysis confirms the presence of two main
Instruments, set to a 200 Hz sampling frequency. joint families: NNW-SSE and NE-SW (Figs. 6 and 7). The
The seismic noise records were processed using Geopsy NNW-SSE joint set seems to have a significant relevance in
software (www.geopsy.org). The 1-h time histories were the structural setting of the area and in the development of