Page 7 - Falconi_et_al_2017
P. 7

128                                                                                     L. Falconi et al.


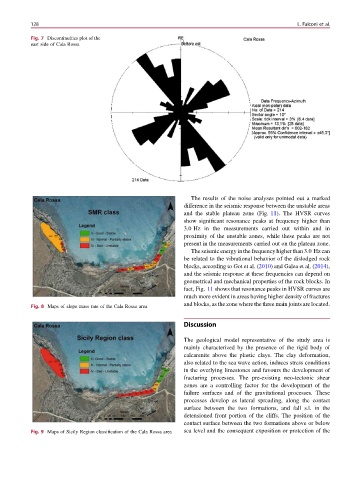
           Fig. 7 Discontinuities plot of the
           east side of Cala Rossa


                                                                The results of the noise analyses pointed out a marked
                                                              difference in the seismic response between the unstable areas
                                                              and the stable plateau zone (Fig. 11). The HVSR curves
                                                              show significant resonance peaks at frequency higher than
                                                              3.0 Hz in the measurements carried out within and in
                                                              proximity of the unstable zones, while these peaks are not
                                                              present in the measurements carried out on the plateau zone.
                                                                The seismic energy in the frequency higher than 3.0 Hz can
                                                              be related to the vibrational behavior of the dislodged rock
                                                              blocks, according to Got et al. (2010) and Galea et al. (2014),
                                                              and the seismic response at these frequencies can depend on
                                                              geometrical and mechanical properties of the rock blocks. In
                                                              fact, Fig. 11 shows that resonance peaks in HVSR curves are
                                                              much more evident in areas having higher density of fractures
                                                              and blocks, as the zone where the three main joints are located.
           Fig. 8 Maps of slope mass rate of the Cala Rossa area

                                                              Discussion


                                                              The geological model representative of the study area is
                                                              mainly characterized by the presence of the rigid body of
                                                              calcarenite above the plastic clays. The clay deformation,
                                                              also related to the sea wave action, induces stress conditions
                                                              in the overlying limestones and favours the development of
                                                              fracturing processes. The pre-existing neo-tectonic shear
                                                              zones are a controlling factor for the development of the
                                                              failure surfaces and of the gravitational processes. These
                                                              processes develop as lateral spreading, along the contact
                                                              surface between the two formations, and fall s.l. in the
                                                              detensioned front portion of the cliffs. The position of the
                                                              contact surface between the two formations above or below
           Fig. 9 Maps of Sicily Region classification of the Cala Rossa area  sea level and the consequent exposition or protection of the
   2   3   4   5   6   7   8   9   10