
Page 16 - Pepe_Corradino_alii_2018
P. 16
206 F. Pepe et al. / Geomorphology 303 (2018) 191–209
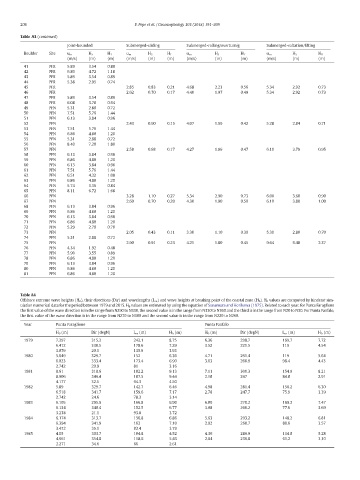
Table A3 (continued)
Joint-bounded Submerged-sliding Submerged-rolling/overturnig Submerged-saltation/lifting
Boulder Site u m H S H T u m H S H T u m H S H T u m H S H T
(m/s) (m) (m) (m/s) (m) (m) (m/s) (m) (m) (m/s) (m) (m)
41 PFR 5.89 3.54 0.89
42 PFR 6.80 4.72 1.18
43 PFR 5.89 3.54 0.89
44 PFR 5.38 2.95 0.74
45 PFR 2.85 0.83 0.21 4.68 2.23 0.56 5.34 2.92 0.73
46 PFR 2.62 0.70 0.17 4.40 1.97 0.49 5.34 2.92 0.73
47 PFR 5.89 3.54 0.89
48 PFR 6.08 3.78 0.94
49 PFN 5.31 2.88 0.72
50 PFN 7.51 5.76 1.44
51 PFN 6.13 3.84 0.96
52 PFN 2.43 0.60 0.15 4.07 1.69 0.42 5.28 2.84 0.71
53 PFN 7.51 5.76 1.44
54 PFN 6.86 4.80 1.20
55 PFN 5.31 2.88 0.72
56 PFN 8.40 7.20 1.80
57 PFN 2.58 0.68 0.17 4.27 1.86 0.47 6.10 3.79 0.95
58 PFN 6.13 3.84 0.96
59 PFN 6.86 4.80 1.20
60 PFN 6.13 3.84 0.96
61 PFN 7.51 5.76 1.44
62 PFN 6.51 4.32 1.08
63 PFN 6.86 4.80 1.20
64 PFN 5.74 3.36 0.84
65 PFN 8.11 6.72 1.68
66 PFN 3.28 1.10 0.27 5.34 2.90 0.73 6.00 3.60 0.90
67 PFN 2.60 0.70 0.20 4.30 1.90 0.50 6.10 3.80 1.00
68 PFN 6.13 3.84 0.96
69 PFN 6.86 4.80 1.20
70 PFN 6.13 3.84 0.96
71 PFN 6.86 4.80 1.20
72 PFN 5.29 2.78 0.70
73 PFN 2.05 0.43 0.11 3.30 1.10 0.30 5.30 2.80 0.70
74 PFN 5.31 2.88 0.72
75 PFN 2.90 0.91 0.23 4.21 1.80 0.45 9.64 9.48 2.37
76 PFN 4.34 1.92 0.48
77 PFN 5.90 3.55 0.89
78 PFN 6.86 4.80 1.20
79 PFN 6.13 3.84 0.96
80 PFN 6.86 4.80 1.20
81 PFN 6.86 4.80 1.20
Table A4
Offshore extreme wave heights (H 0 ), their directions (Dir) and wavelengths (L m ) and wave heights at breaking point of the coastal zone (H b ). H 0 values are computed by hindcast sim-
ulation numerical data for the period between 1979 and 2015. H b values are estimated by using the equation of Sunamura and Horikawa (1975). Related to each year, for Punta Faraglione
the first value of the wave direction is in the range from N290 to N330, the second value is in the range from N330 to N360 and the third is in the range from N20 to N30. For Punta Fanfalo,
the first value of the wave direction is in the range from N270 to N300 and the second value is in the range from N220 to N260.
Year Punta Faraglione Punta Fanfalo
H 0 (m) Dir (degN) L m (m) H b (m) H 0 (m) Dir (degN) L m (m) H b (m)
1979 7.397 315.3 242.1 8.75 6.36 298.7 169.7 7.72
6.412 330.5 178.6 7.29 3.52 221.5 119 4.54
3.079 20.1 135.9 3.93
1980 5.649 329.7 152 6.36 4.71 291.4 119 5.64
6.023 333.4 173.4 6.90 3.63 260.9 98.4 4.43
2.742 20.9 81 3.16
1981 8.61 318.6 182.2 9.13 7.11 300.3 154.9 8.21
8.906 346.4 187.5 9.44 2.18 247 84.8 2.91
4.177 32.5 94.3 4.50
1982 5.89 329.7 142.7 6.46 4.98 281.4 156.2 6.30
6.518 341.7 159.6 7.17 2.78 247.7 75.9 3.39
2.742 24.6 78.3 3.14
1983 6.105 295.6 166.8 6.90 6.09 279.2 169.2 7.47
6.134 348.4 152.5 6.77 3.08 260.2 77.9 3.69
3.238 21.1 93.8 3.72
1984 6.174 313.7 156.8 6.86 5.63 293.2 148.2 6.81
6.394 341.9 162 7.10 2.92 260.7 80.6 3.57
3.472 35.1 82.4 3.79
1985 4.05 303.7 104.8 4.52 4.36 286.9 114.8 5.28
4.961 354.8 118.6 5.43 2.64 236.8 61.2 3.10
2.271 34.6 66 2.61