
Page 12 - Pepe_Corradino_alii_2018
P. 12
202 F. Pepe et al. / Geomorphology 303 (2018) 191–209
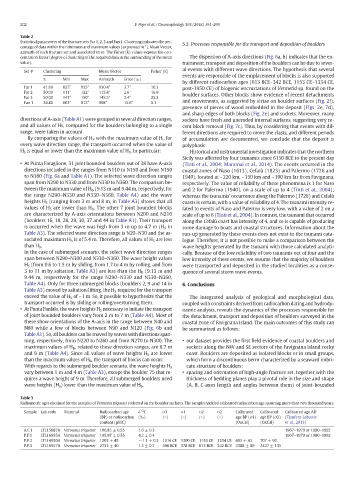
Table 2
Statistical parameters of the fracture sets Far 1, 2, 3 and Fan 1. Clustering indicates the per-
centage of data within the minimum and maximum values (expressed in °). Mean Vector, 5.3. Processes responsible for the transport and deposition of boulders
azimuth of each fracture set and associated error. The Fisher (k) values express the con-
centration factor (degree of clustering of the acquired data in the surrounding of the mean The dispersion of A-axis directions (Fig. 6a, b) indicates that the en-
value). trainment, transport and deposition of the boulders can be due to sever-
al events with different wave directions. The hypothesis that several
Set # Clustering Mean Vector Fisher (K)
events are responsible of the emplacement of blocks is also supported
% Min Max Azimuth Error (±)
by different radiocarbon ages (613 BCE–342 BCE, 1153 CE–1334 CE,
Far 1 41.60 027° 035° 030.4° 3.7° 10.3 post-1950 CE) of biogenic encrustations of Vermetid sp. found on the
Far 2 50.00 111° 122° 115.4° 2.6° 16.9 boulder surfaces. Other blocks show evidence of recent detachments
Far 3 50.00 141° 150° 145.5° 2.4° 25.2
Fan 1 34.80 003° 012° 008° 15.6° 6.1 and movements, as suggested by striae on boulder surfaces (Fig. 2f),
presence of pieces of wood embedded in the deposit (Figs. 2e, 7d),
and sharp edges of both blocks (Fig. 2e) and sockets. Moreover, many
directions of A-axis (Table A1) were grouped in several direction ranges, sockets have fresh and uneroded internal surfaces, suggesting very re-
and all values of Hs, computed for the boulders belonging to a single cent block removal (Fig. 7c). Thus, by considering that events with dif-
range, were taken in account. ferent directions are required to move the clasts, and different periods
By comparing the values of H S with the maximum value of H b for of accumulation are documented, we conclude that the deposit is
every wave direction range, the transport occurred when the value of polyphasic.
H S is equal or lower than the maximum value of H b .Inparticular: Historical and instrumental investigation indicates that the northern
Sicily was affected by four tsunamis since 6150 BCE to the present day
• At Punta Faraglione, 31 joint bounded boulders out of 38 have A-axis (Tinti et al., 2004; Maramai et al., 2014). The events occurred in the
directions included in the ranges from N110 to N150 and from N150 coastal zones of Naso (1613), Cefalù (1823) and Palermo (1726 and
to N180 (Fig. 6a and Table A1). The selected wave direction ranges 1940), located at ~220 km, ~150 km and ~100 km far from Favignana,
span from N290 to N330 and from N330 to N360. The comparison be- respectively. The value of reliability of these phenomena is 1 for Naso
tween the maximum value of H b (9.13 m and 9.44 m, respectively, for and 2 for Palermo (1940), on a scale of up to 4 (Tinti et al., 2004);
the range N290–N330 and N330–N360, Table A4) and the wave whereas the tsunamis' occurrence along the Palermo (1726) and Cefalù
heights H S (ranging from 2 m and 8 m, in Table A3) shows that all coasts is certain, with a value of reliability of 4. The tsunami intensity re-
values of H S are lower than H b . The other 7 joint bounded blocks lated to events of Naso and Palermo is very low, with a value of 2 on a
are characterized by A-axis orientations between N200 and N210 scale of up to 6 (Tinti et al., 2004). In contrast, the tsunami that occurred
(boulders 16, 18, 28, 29, 30, 37 and 44 in Table A1). Their transport along the Cefalù coast has intensity of 4, and so is capable of producing
is occurred when the wave was high from 3 m up to 4.7 m (H S in some damage to boats and coastal structures. Information about the
Table A3). The selected wave direction range is N20–N30 and the as- run-up generated by these events does not exist in the tsunami cata-
sociated maximum H b is of 5.4 m. Therefore, all values of H S are less logue. Therefore, it is not possible to make a comparison between the
than H b . wave heights generated by the tsunami with those calculated analyti-
In the case of submerged scenario, the select wave direction ranges cally. Because of the low reliability of two tsunamis out of four and the
span between N290–N300 and N330–N360. The wave height values low intensity of these events, we assume that the majority of boulders
H S (from 0.6 to 1.5 m by sliding, from 1.7 to 4 m by rolling, and from were transported and deposited in the studied localities as a conse-
3 to 11 m by saltation, Table A3) are less than the H b (9.13 m and quence of several storm wave events.
9.44 m, respectively for the range N290–N330 and N330–N360,
Table A4). Only for three submerged blocks (boulders 2, 9 and 14 in 6. Conclusions
Table A3) moved by saltation/lifting, the H S required for the transport
exceed the value of H b of ~1 m. So, it possible to hypothesize that the The integrated analysis of geological and morphological data,
transport occurred is by sliding or rolling/overturning them. coupled with constraints derived from radiocarbon dating and hydrody-
• At Punta Fanfalo, the wave heights H S necessary to initiate the transport namic analysis, reveals the dynamics of the processes responsible for
of joint bounded boulders vary from 2 m to 7 m (Table A4). Most of the detachment, transport and deposition of boulders surveyed in the
these show orientations of the A-axis in the range between N40 and coastal zone of Favignana Island. The main outcomes of this study can
N80 while a few of blocks between N90 and N120 (Fig. 6b and be summarized as follows:
Table A1). So, all boulders can be moved by waves with directions span-
ning, respectively, from N220 to N260 and from N270 to N300. The • our dataset provides the first field evidence of coastal boulders and
maximum values of H b , related to these direction ranges, are 6.7 m sockets along the NW and SE sectors of the Favignana Island rocky
and 9 m (Table A4). Since all values of wave heights H S are lower coast. Boulders are deposited as isolated blocks or in small groups,
than the maximum values of H b , the transport of blocks can occur. which form a discontinuous berm characterized by a seaward imbri-
cate structure of boulders;
With regards to the submerged boulder scenario, the wave heights H S
vary between 1 m and 4 m (Table A3), except the boulder 75 that re- • spacing and orientation of high-angle fracture set, together with the
quires a wave height of 9 m. Therefore, all submerged boulders need thickness of bedding planes play a pivotal role in the size and shape
wave heights (H S ) lower than the maximum value of H b . (A, B, C-axes length and angles between them) of joint-bounded
Table 3
Radiometric ages obtained for the samples of Vermetus triqueter collected on the boulder surfaces. The samples yielded calibrated radiocarbon age spanning more than two thousand years.
13
Sample Lab code Material Radiocarbon age δ C σ1 σ1 σ2 σ2 Calibrated Calibrated Calibrated age AD
(BP) or radiocarbon (‰) (N) (b) (N) (b) age BP (σ1) age BP (σ2) (Tisnérat-Laborde
content (pMC) (OxCal) (OxCal) et al., 2013)
A.F.1 LTL15087A Vermetus triqueter 106.85 ± 0.55 1.6 ± 0.3 1967–1970 or 1980–1992
P.F.1 LTL16955A Vermetus triqueter 105.97 ± 0.55 4.2 ± 0.4 1967–1970 or 1980–1992
P.F.2 LTL16956A Vermetus triqueter 1203 ± 45 −1.1 ± 0.3 1216 CE 1300 CE 1153 CE 1334 CE 692 ± 42 707 ± 90
P.F.3 LTL16957A Vermetus triqueter 2753 ± 40 1.3 ± 0.7 498 BCE 378 BCE 613 BCE 342 BCE 2388 ± 60 2427 ± 135