
Page 8 - Pepe_Corradino_alii_2018
P. 8
198 F. Pepe et al. / Geomorphology 303 (2018) 191–209
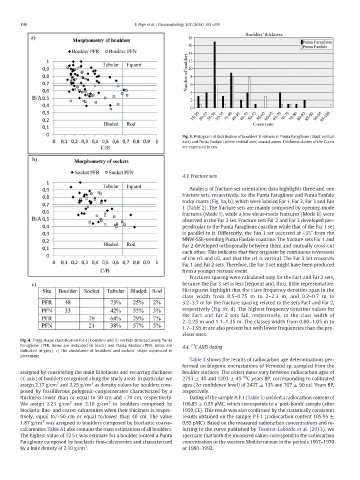
Fig. 5. Histogram of distribution of boulders' thickness in Punta Faraglione (black vertical
axis) and Punta Fanfalo (white vertical axis) coastal zones. Thickness classes of the C-axis
are expressed in cm.
4.3. Fracture sets
Analysis of fracture set orientation data highlights three and one
fracture sets, respectively, for the Punta Faraglione and Punta Fanfalo
rocky coasts (Fig. 9a, b), which were labeled Far 1, Far 2, Far 3 and Fan
1(Table 2). The fracture sets are mainly composed by opening-mode
fractures (Mode I), while a few shear-mode fractures (Mode II) were
observed in the Far 3 set. Fracture sets Far 2 and Far 3 developed per-
pendicular to the Punta Faraglione coastline while that of the Far 1 set
is parallel to it. Differently, the Fan 1 set occurred at ~35° from the
NNW-SSE-trending Punta Fanfalo coastline. The fracture sets Far 1 and
Far 2 developed orthogonally between them and mutually cross-cut
each other. This indicates that they originate by continuous inversions
of the σ3and σ2, and that the σ1 is vertical. The Far 3 set crosscuts
Far 1 and Far 2 sets. Therefore, the Far 3 set might have been produced
from a younger tectonic event.
Fractures spacing were calculated only for the Far1 and Far 2 sets,
because the Far 3 set is less frequent and, thus, little representative.
Histograms highlight that the class frequency densities span in the
class width from 0.5–0.75 m to 2–2.3 m, and 0.2–0.7 m to
3.2–3.7 m for the fracture spacing related to the sets Far1 and Far 2,
respectively (Fig. 9c, d). The highest frequency densities values for
the Far1 and Far 2 sets fall, respectively, in the class width of
2–2.25 m and 1.1–1.35 m. The classes width from 0.80–1.05 m to
1.7–1.95 m are also present but with lower frequencies than the pre-
vious ones.
Fig. 4. Zingg shape classification for a) boulders and b) sockets detected along Punta
Faraglione (PFR, items are indicated in black) and Punta Fanfalo (PFN, items are 4.4. 14 CAMS dating
indicated in grey). c) The abundance of boulders' and sockets' shape expressed in
percentage.
Table 3 shows the results of radiocarbon age determinations per-
formed on biogenic encrustations of Vermetid sp. sampled from the
assigned by considering the main lithofacies and recurring thickness boulder surfaces. The oldest dates vary between radiocarbon ages of
(C axis) of boulders recognized along the study areas. In particular we 2753 ± 40 and 1203 ± 45 14 C years BP, corresponding to calibrated
3
3
assign 2.37 g/cm and 2.25 g/cm as density values for boulders com- ages (2σ confidence level) of 2427 ± 135 and 707 ± 90 cal. Years BP,
posed by fossiliferous polygenic-conglomerates characterized by a respectively.
thickness lower than or equal to 30 cm and ~70 cm, respectively. Dating of the sample A.F.1 (Table 3) yielded a radiocarbon content of
3
3
We assign 2.23 g/cm and 2.10 g/cm to boulders composed by 106.85 ± 0.55 pMC, which corresponds to a ‘post-bomb’ sample (after
bioclastic fine- and coarse-calcarenites when their thickness is, respec- 1950 CE). This result was also confirmed by the statistically consistent
tively, equal to/N50 cm or equal to/lower than 40 cm. The value results obtained on the sample P.F.1 (radiocarbon content 105.95 ±
3
1.87 g/cm was assigned to boulders composed by bioclastic coarse- 0.55 pMC). Based on the measured radiocarbon concentrations and re-
calcarenites. Table A1 also contains the mass estimations of all boulders. ferring to the curve published by Tisnérat-Laborde et al. (2013),we
The highest value of 12.5 t was estimate for a boulder located a Punta speculate that both the measured values correspond to the radiocarbon
Faraglione composed by bioclastic fine-calcarenites and characterized concentration in the western Mediterranean in the periods 1967–1970
3
by a bulk density of 2.10 g/cm . or 1980–1992.