
Page 9 - Pepe_Corradino_alii_2018
P. 9
F. Pepe et al. / Geomorphology 303 (2018) 191–209 199
wave heights (H T in Table A3) vary between tens of centimeters up to
2.8 m.
In the case of boulders detected along the Punta Fanfalo coastal zone,
results obtained by hydrodynamic equations of Nandasena show that
the minimum flow velocities for joint bounded boulders must be in
the range from ~4 m/s to ~8 m/s. In the submerged scenario, flow veloc-
ities vary from ~2 m/s to ~3 m/s for submerged boulders moved by slid-
ing, from ~3 m/s to ~5 m/s for blocks transported by rolling/
overturning, and from ~5 m/s to ~9.5 m/s when the transport occurs
by saltation/lifting (Table A3). Furthermore, the joint bounded boulders
can be transported when storm waves are high, from ~2 m and ~7 m.
Submerged boulders transported by sliding and rolling/overturning
need storm wave height not exceeding 1 m and 3 m, respectively. In-
stead, wave height between ~3 m and ~9 m are necessary for sub-
merged boulders moved by saltation/lifting. Alternatively, transport of
boulders by a tsunami would occur when the wave heights are from
few tens of centimeters up to ~2 m (Table A3).
4.6. Hindcast numerical simulation data
Table A4 shows the hindcast data related to the two studied sites. In
particular, we have selected the H b values with directions parallel to the
A-axis directions measured for each boulder. Therefore, the selected H b
values have directions ranging from N290 to N330, from N330 to N360,
from N20 to N30 for Punta Faraglione, and from N270 to N300, from
N220 to N260 for Punta Fanfalo.
The hindcast data of the offshore of Punta Faraglione indicate that
the significant waves oriented between N290-N330 have heights span-
ning from a minimum value of ~4 m in 1989 up to ~8.5 m reached in
1981 (Table A4). In the other two wave direction classes, N330-N360
and N20-N30, the significant wave heights are ranging, respectively,
from ~3.5 m to ~9 m (years 2010 and 1981 in Table A4) and from
~2 m to ~5 m (years 1993 and 2015 in Table A4). By applying the
Sunamura and Horikawa (1975)equation to offshore wave height
values, the wave height at the breaking point for the coastal area are be-
tween ~4.5 m and ~9 m, ~4 and ~9.50, and 2.3 and ~5.5, respectively, for
the direction ranges of N290–N330, N330–N360 and N20–N30.
The hindcast data related to the offshore of Punta Fanfalo show that
the significant waves with directions falling between N270 and N300
have heights from ~4 m to ~7.50 m, computed for the years 1997 and
1987, respectively (Table A4). The significant wave heights, related to
the wave direction class of N220-N260, assume values between 2 m in
1991 and 5.5 m in 1987. The results computed by the Sunamura and
Horikawa (1975) equation indicate that the waves at the breaking
point have heights ranging from ~5 m to ~9 m and from ~2.5 m to
~6.7 m, respectively, in the wave direction ranges of N270-N300 and
N220-N260.
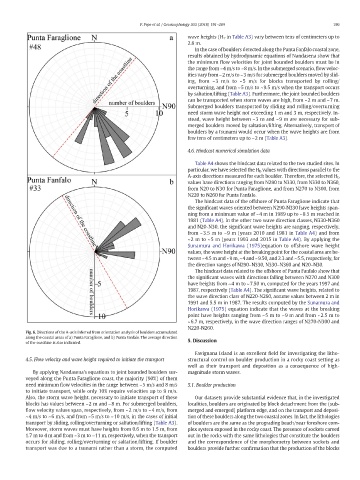
Fig. 6. Directions of the A-axis inferred from orientation analysis of boulders accumulated
along the coastal areas of a) Punta Faraglione, and b) Punta Fanfalo. The average direction
of the coastline is also indicated. 5. Discussion
Favignana Island is an excellent field for investigating the litho-
4.5. Flow velocity and wave height required to initiate the transport structural control on boulder production in a rocky coast setting as
well as their transport and deposition as a consequence of high-
By applying Nandasena's equations to joint bounded boulders sur- magnitude storm waves.
veyed along the Punta Faraglione coast, the majority (90%) of them
need minimum flow velocities in the range between ~5 m/s and 8 m/s 5.1. Boulder production
to initiate transport, while only 10% require velocities up to 9 m/s.
Also, the storm wave height, necessary to initiate transport of these Our datasets provide substantial evidence that, in the investigated
blocks has values between ~2 m and ~8 m. For submerged boulders, localities, boulders are originated by block detachment from the (sub-
flow velocity values span, respectively, from ~2 m/s to ~4 m/s, from merged and emerged) platform edge, and on the transport and deposi-
~4 m/s to ~6 m/s, and from ~5 m/s to ~10 m/s, in the cases of initial tion of these boulders along the two coastal zones. In fact, the lithologies
transport by sliding, rolling/overturning or saltation/lifting (Table A3). of boulders are the same as the prograding beach/near foreshore com-
Moreover, storm waves must have heights from 0.6 m to 1.5 m, from plex system exposed in the rocky coast. The presence of sockets carved
1.7 m to 4 m and from ~3 m to ~11 m, respectively, when the transport out in the rocks with the same lithologies that constitute the boulders
occurs for sliding, rolling/overturning or saltation/lifting. If boulder and the correspondence of the morphometry between sockets and
transport was due to a tsunami rather than a storm, the computed boulders provide further confirmation that the production of the blocks