
Page 10 - Tondi_Ciilona_alii_2012
P. 10
Author's personal copy
62 E. Tondi et al. / Journal of Structural Geology 37 (2012) 53e64
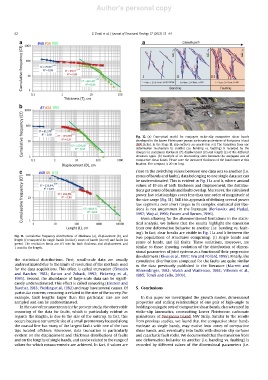
Fig. 12. (a) Conceptual model for conjugate strike-slip compactive shear bands
developed in the Lower Pleistocene porous carbonate grainstones of Favignana Island
(NW Sicily). In the Stage III, slip surfaces are marked in red. The transition from one
deformation mechanism to another (i.e. banding vs. faulting) is recorded by the
changes in maximum thickness (T), displacement (D) and length (L) of the different
structure types. (b) Example of an intersecting zone between the conjugate sets of
compactive shear bands. Please note the increased thickness of the band zones at this
location. The compass is 20 cm long.
close to the switching values between one data sets to another (i.e.
zones of bands and faults), data belonging to one single data set can
be underestimated. This is evident in Fig. 11a and b, where around
values of 10 cm of both thickness and displacement, the distribu-
tions got zones of bands and faults overlap. Moreover, the calculated
power law relationships cover less than one order of magnitude of
the size range (Fig. 11). Still this approach of defining several power
law segments over short ranges to fit complex statistical distribu-
tions is not uncommon in the literature (Berkowitz and Hadad,
1997; Wojtal, 1996; Fossen and Rørnes, 1996).
Even allowing for the aforementioned limitations in the statis-
tical analysis, we believe that the results highlight the transition
from one deformation behavior to another (i.e. banding vs. fault-
ing). In fact, clear breaks are visible in Fig. 11a and b between the
Fig. 11. Cumulative frequency distributions of thickness (a), displacement (b), and two populations of structures comprising: (i) single bands and
length (c) computed for single bands (in blue), zones of bands (in red) and faults (in
green). The resolution limits are 0.5 mm for both thickness and displacement and zones of bands, and (ii) faults. These variations, moreover, are
1 mm for the length. similar to those showing evolution of the distribution of dimen-
sional parameters of joint systems as a function of their progressive
development (Rives et al., 1992; Wu and Pollard, 1995). Finally, the
the statistical distributions. First, small-scale data are usually cumulative distributions computed for the faults are quite similar
underestimated due to the limits of resolution of the methods used
to the data previously published in the literature (Marrett and
for the data acquisitions. This effect is called truncation (Einstein Allmendinger, 1992; Walsh and Watterson, 1992; Villemin et al.,
and Baecher, 1983; Barton and Zoback, 1992; Pickering et al.,
1995; Tondi and Cello, 2003).
1995). Second, the abundance of large-scale data can be signifi-
cantly underestimated. This effect is called censoring (Einstein and
Baecher,1983; Yielding et al.,1992) and may have several causes. Of 5. Conclusions
particular concern, censoring is related to the size of the survey. For
example, fault lengths larger than this particular size are not In this paper we investigated the growth modes, dimensional
sampled and can be underestimated. properties and scaling relationships of one pair of high-angle to
In the case of measurements in the present study, the observable bedding conjugate sets of compactive shear bands, characterized by
censoring of the data for faults, which is particularly evident as strike-slip kinematics, crosscutting Lower Pleistocene carbonate
regards the lengths, is due to the size of the outcrop. In fact, this grainstones of Favignana Island, NW Sicily. Similar to the results
occurs because our sample site of a small promontory located along from previous studies, we found that the compactive shear bands
the coastal line has many of the largest faults with one of the two nucleate as single bands, may evolve into zones of compactive
tips located offshore. Moreover, data truncation is particularly shear bands, and, eventually, into faults with discrete slip surfaces
evident on the displacement and thickness distributions of faults and cataclastic fault rocks. We documented that the transition from
and on the lengths of single bands, and can be related to the range of one deformation behavior to another (i.e. banding vs. faulting) is
values for which measurements are achieved. In fact, if values are recorded by different values of the dimensional parameters (i.e.