
Page 9 - Tondi_Ciilona_alii_2012
P. 9
Author's personal copy
E. Tondi et al. / Journal of Structural Geology 37 (2012) 53e64 61
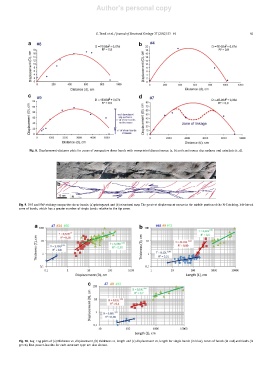
Fig. 8. Displacement-distance plots for zones of compactive shear bands with overprinted discontinuous (a, b) and continuous slip surfaces and cataclasis (c, d).
Fig. 9. N-S and NW-striking compactive shear bands; (a) photograph and (b) structural map. The greatest displacement occurs in the middle portion of the N-S striking, left-lateral
zone of bands, which has a greater number of single bands relative to the tip zones.
Fig. 10. LogeLog plots of (a) thickness vs. displacement, (b) thickness vs. length and (c) displacement vs. length for single bands (in blue), zones of bands (in red) and faults (in
green). Best power-law fits for each structure type are also shown.