
Page 4 - Tondi_Ciilona_alii_2012
P. 4
Author's personal copy
56 E. Tondi et al. / Journal of Structural Geology 37 (2012) 53e64
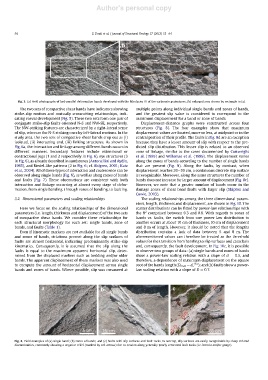
Fig. 3. (a) Field photographs of bed-parallel deformation bands developed with the lithofacies IV of the carbonate grainstones, (b) enlarged area shown by rectangle in (a).
The two sets of compactive shear bands have indicators showing multiple points along individual single bands and zones of bands,
strike-slip motion and mutually crosscutting relationships, indi- and the greatest slip value is considered to correspond to the
cating coeval development (Fig. 5). These two sets form one pair of maximum displacement for a band or zone of bands.
conjugate strike-slip faults oriented N-S and NW-SE, respectively. Displacement-distance graphs were constructed across four
The NW-striking features are characterized by a right-lateral sense structures (Fig. 8). The four examples show that maximum
of slip, whereas the N-S striking ones by left-lateral motions. In the displacement values are located, more or less, at midpoint or in the
study area, the two sets of compactive shear bands crop out as (i) central portion of their profile. The faults in Fig. 8d are an exception
isolated, (ii) interacting and, (iii) linking structures. As shown in because they have a lesser amount of slip with respect to the pre-
Fig. 6a, the interaction and linkage among different bands occurs in dicted slip distribution. This lesser slip is related to an observed
different manners. Secondary features include extensional or zone of linkage, similar to the cases documented by Cartwright
contractional jogs (1 and 2 respectively in Fig. 6), eye structures (3 et al. (1995) and Willemse et al. (1996). The displacement varies
in Fig. 6), as already described in sandstones (Antonellini and Aydin, along the zones of bands according to the number of single bands
1995), and Riedel-like patterns (2 in Fig. 6; cf. Ahlgren, 2001; Katz that are present (Fig. 9). Along the faults, by contrast, when
et al., 2004). All of these types of interaction and coalescence can be displacement reaches 20e30 cm, a continuous discrete slip surface
observed along single bands (Fig. 6), as well as along zones of bands is recognizable. Moreover, along the same structures the number of
and faults (Fig. 7). These observations are consistent with both bands does not increase for larger amount of displacement (Fig. 8c).
interaction and linkage occurring at almost every stage of defor- However, we note that a greater number of bands occur in the
mation, from single banding, through zones of banding, to faulting. damage zones of shear band faults with larger slip (Shipton and
Cowie, 2003).
3.2. Dimensional parameters and scaling relationships The scaling relationships among the three dimensional param-
eters, length, thickness and displacement, are shown in Fig. 10. The
Here we focus on the scaling relationships of the dimensional scatter distributions can be fitted by power-law relationships with
2
parameters (i.e. length, thickness and displacement) of the two sets the R comprised between 0.3 and 0.8. With regards to zones of
of compactive shear bands. We consider these relationships for bands vs. faults, the switch from one power law distribution to
each structural morphology for each set: single bands, zone of another occurs at about 10 cm of thickness, 10 cm of displacement
bands, and faults (Table 1). and 8 m of length. However, it should be noted that the lengths
Even if kinematic markers are not available for all single bands distribution contains a lack of data between 5 and 8 m. The
and zones of bands, striations present along the slip surfaces of aforementioned values can therefore be treated as the threshold
faults are almost horizontal, indicating predominantly strike-slip values for the transition from banding to slip surfaces and cataclasis
kinematics. Consequently, it is assumed that the slip along the and, consequently, the fault development. In Fig. 10c, it is possible
faults is equal to the maximum apparent horizontal slip, deter- to observe two groups of data: (a) single bands and zones of bands
mined from the displaced markers such as bedding and/or older show a power-law scaling relation with a slope of D ¼ 0.5, and
bands. The apparent displacement of these markers was also used therefore, a dependence of maximum displacement on the square
to compute the amount of horizontal displacement across single root of the bands length (D max ¼ aL 0.5 ); and (b) faults show a power-
bands and zones of bands. Where possible, slip was measured at law scaling relation with a slope of D ¼ 0.7.
Fig. 4. Field examples of (a) single band; (b) zones of bands; and (c) faults with slip surfaces and fault rocks. In outcrop, slip surfaces are easily recognizable by sharp striated
discontinuities, commonly showing a negative relief (marked by red arrows) due to erosion along generally poorly cemented fault rocks (i.e. breccia and/or gouge).