
Page 9 - Assessment
P. 9
D. Melaku Canu et al. / Marine Pollution Bulletin xxx (2015) xxx–xxx 9
Fig. 6 (continued)
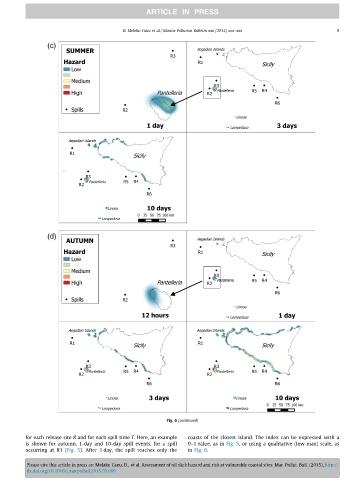
for each release site R and for each spill time T. Here, an example coasts of the closest island. The index can be expressed with a
is shown for autumn, 1-day and 10-day spill events, for a spill 0–1 value, as in Fig. 5, or using a qualitative (low-max) scale, as
occurring at R1 (Fig. 5). After 1 day, the spill reaches only the in Fig. 6.
Please cite this article in press as: Melaku Canu, D., et al. Assessment of oil slick hazard and risk at vulnerable coastal sites. Mar. Pollut. Bull. (2015), http://
dx.doi.org/10.1016/j.marpolbul.2015.03.006