
Page 6 - Assessment
P. 6
6 D. Melaku Canu et al. / Marine Pollution Bulletin xxx (2015) xxx–xxx
estimation with a radius of 100 m on a raster with 100 m res- periods. The Sirocco wind events were generally characterized by
olution, and rescaled for each season separately to the range 0–1. lower average and maximum speed values, approximately 4–
Multiplying the 10-day seasonal hazard index by the sensitivity 5 m/s and 10–15 m/s, respectively, with higher frequency and
map. intensity computed during the spring season.
A risk index (RI) ranging from 0 to 2 was then obtained for each The oceanographic general circulation pattern responded to
point along the coast by multiplying the ESI and the HI 10,i . prevailing meteorological conditions as summarized in Fig. 3,
which illustrates the residual circulation of different seasons (the
RI ¼ HI 10;i ESI
algebraic seasonal average of the computed surface flow field,
These values were further interpolated with a power to a i.e., the ‘net’ circulation for each season). During the year, the
inverse distance weighted method over a 5000 m wide buffer zone
around the coastline, log-transformed and rescaled to a raster with
resolution 2000 m for better visualization. Table 1
Statistics of the oil spill fate expressed as % of total released oil particles reaching the
3. Results coast (Onshore) and maximum density observed in the coastal area, given as a % of
the total amount of stranded particles (Maxima). Results refer to the 10-day scenario.
3.1. Analysis of atmospheric and oceanographic scenarios Oil particles Tot. (%) R1 (%) R2 (%) R3 (%) R4 (%) R5 (%) R6 (%)
Tot. onshore 20 29 24 20 17 13 16
Hazard assessment was carried out considering the seasonal
Winter scenario results
variability of wind waves, surface water current fields, trajectories, Onshore 26 47 50 18 22 12 8
and stranding points of the numerical particles along the shore- Maxima 7 6 19 12 8 8 14
lines. Fig. 2 illustrates the seasonal variability of the wind speed Spring scenario results
and direction in the area, as computed by the adopted atmospheric Onshore 16 18 5 10 23 18 19
model. During the winter, spring and autumn, most wind events Maxima 3 14 18 10 4 10 12
were characterized by one of two wind regimes: the Mistral (from Summer scenario results
North West) and the Sirocco (from South East), whereas during Onshore 13 14 7 39 6 5 5
summer, only the Sirocco wind regime characterized the area. Maxima 8 8 8 15 27 7 10
Mistral wind events were characterized by average speed val- Autumn scenario results
ues of approximately 7–8 m/s and by maximum values of more Onshore 27 39 36 16 18 18 33
7
8
Maxima
5
2
10
6
8
than 17 m/s, computed especially during winter and autumn
st
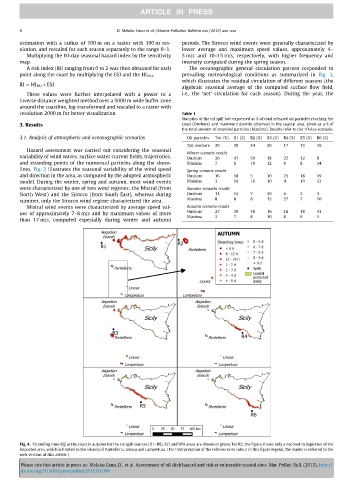
Fig. 4. Stranding time H RI at the coast in autumn for the six spill sources (R1–R6). SCI and SPA areas are shown in green. For R2, the figure shows only a zoomed in depiction of the
impacted area, which is limited to the islands of Pantelleria, Linosa and Lampedusa. (For interpretation of the references to colour in this figure legend, the reader is referred to the
web version of this article.)
Please cite this article in press as: Melaku Canu, D., et al. Assessment of oil slick hazard and risk at vulnerable coastal sites. Mar. Pollut. Bull. (2015), http://
dx.doi.org/10.1016/j.marpolbul.2015.03.006