
Page 10 - Beccali_Ciulla_alii_2016
P. 10
0332-10
It follows that monthly energy demand for hotels is evaluated according to the previous
method by applying Eq. (3) and (4):
E TOT .h /c .hotel E h /c .hotel N bed Occ month ) 3 (
E TOT .DHW .hotel E DHW .hotel N bed Occ month ) 4 (
where: ETOT.h/c.hotel and ETOT.DHW.hotel are the monthly energy demands of the cluster for
respectively heating/cooling purposes and Domestic Hot Water supply, Nbed is the number of
pax in the hotel and Occ is a parameter taking into account the touristic vocation of Italian
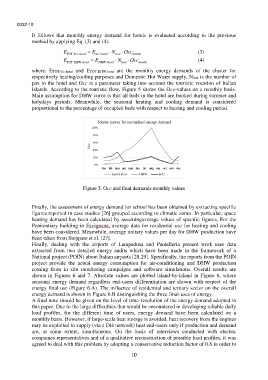
Islands. According to the touristic flow, Figure 5 shows the Occ-values on a monthly basis.
Main assumption for DHW curve is that all beds in the hotel are booked during summer and
holydays periods. Meanwhile, the seasonal heating and cooling demand is considered
proportional to the percentage of occupied beds with respect to heating and cooling period.
Figure 5. Occ and final demands monthly values
Finally, the assessment of energy demand for school has been obtained by extracting specific
figures reported in case studies [26] grouped according to climatic zones. In particular, space
heating demand has been calculated by assumingaverage values of specific figures. For the
Penitentiary building in Favignana, average data for residential use for heating and cooling
have been considered. Meanwhile, average unitary values per day for DHW production have
been taken from Stoppato et al. [27].
Finally, dealing with the airports of Lampedusa and Pantelleria present work uses data
extracted from two detailed energy audits which have been made in the framework of a
National project (POIN) about Italian airports [28,29]. Specifically, the reports from the POIN
project provide the actual energy consumption for air-conditioning and DHW production
coming from in situ monitoring campaigns and software simulations. Overall results are
shown in Figures 6 and 7. Absolute values are plotted island-by-island in Figure 6, where
seasonal energy demand regardless end-users differentiation are shown with respect of the
energy final use (Figure 6.A). The influence of residential and tertiary sector on the overall
energy demand is shown in Figure 6.B distinguishing the three final-uses of energy.
A final note should be given on the level of time-resolution of the energy demand adopted in
this paper. Due to the large difficulties that would be encountered in developing reliable daily
load profiles, for the different time of users, energy demand have been calculated on a
monthly basis. However, if large-scale heat storage is avoided, heat recovery from the engines
may be exploited to supply (via a DH network) heat end-users only if production and demand
are, at some extent, simultaneous. On the basis of interviews conducted with electric
companies representatives and of a qualitative reconstruction of possible load profiles, it was
agreed to deal with this problem by adopting a conservative reduction factor of 0.8 in order to
10