
Page 15 - Beccali_Ciulla_alii_2016
P. 15
0332-15
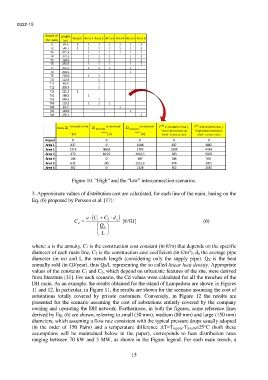
Figure 10. “High” and the “low” interconnection scenarios.
3. Approximate values of distribution cost are calculated, for each line of the main, basing on the
Eq. (6) proposed by Persson et al. [17]:
a C C d
C d 1 2 a [€/GJ] (6)
Q
S
L
where: a is the annuity, C1 is the construction cost constant (in €/m) that depends on the specific
2
diameter of each main line, C2 is the construction cost coefficient (in €/m ), da the average pipe
diameter (in m) and L the trench length (considering only the supply pipe). QS is the heat
annually sold (in GJ/year), thus QS/L representing the so called linear heat density. Appropriate
values of the constants C1 and C2, which depend on urbanistic features of the site, were derived
from literature [31]. For each scenario, the Cd values were calculated for all the trenches of the
DH main. As an example, the results obtained for the island of Lampedusa are shown in Figures
11 and 12. In particular, in Figure 11, the results are shown for the scenario assuming the cost of
substations totally covered by private customers. Conversely, in Figure 12 the results are
presented for the scenario assuming the cost of substations entirely covered by the company
owning and operating the DH network. Furthermore, in both the figures, some reference lines
derived by Eq. (6) are shown, referring to small (30 mm), medium (80 mm) and large (150 mm)
diameters, which assuming a flow rate consistent with the typical pressure drops usually adopted
(in the order of 150 Pa/m) and a temperature difference ΔT=Tsupply-Treturn=25°C (both these
assumptions will be maintained below in the paper), corresponds to heat distribution rates
ranging between 70 kW and 3 MW, as shown in the Figure legend. For each main trench, a
15