
Page 14 - Beccali_Ciulla_alii_2016
P. 14
0332-14
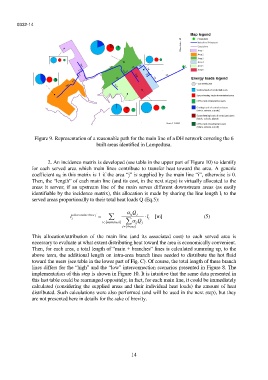
Figure 9. Representation of a reasonable path for the main line of a DH network covering the 6
built areas identified in Lampedusa.
2. An incidence matrix is developed (see table in the upper part of Figure 10) to identify
for each served area which main lines contribute to transfer heat toward the area. A generic
coefficient αij in this matrix is 1 if the area “j” is supplied by the main line “i”, otherwise is 0.
Then, the “length” of each main line (and its cost, in the next steps) is virtually allocated to the
areas it serves; if an upstream line of the main serves different downstream areas (as easily
identifiable by the incidence matrix), this allocation is made by sharing the line length li to the
served areas proportionally to their total heat loads Q (Eq.5):
l i allocated to Area j ij Q j l i [m] (5)
i main lines ij Q j
j Areas
This allocation/attribution of the main line (and its associated cost) to each served area is
necessary to evaluate at what extent distributing heat toward the area is economically convenient.
Then, for each area, a total length of “main + branches” lines is calculated summing up, to the
above term, the additional length on intra-area branch lines needed to distribute the hot fluid
toward the users (see table in the lower part of Fig. C). Of course, the total length of these branch
lines differs for the “high” and the “low” interconnection scenarios presented in Figure 8. The
implementation of this step is shown in Figure 10. It is intuitive that the same data presented in
this last table could be rearranged oppositely; in fact, for each main line, it could be immediately
calculated (considering the supplied areas and their individual heat loads) the amount of heat
distributed. Such calculations were also performed (and will be used in the next step), but they
are not presented here in details for the sake of brevity.
14