
Page 5 - Fiorentino_alii_2008
P. 5
VARIABILITY IN LAND SNAILS 813
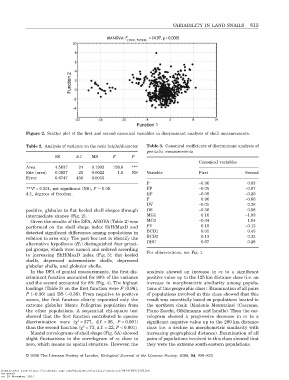
Figure 2. Scatter plot of the first and second canonical variables in discriminant analysis of shell measurements.
Table 2. Analysis of variance on the ratio height/diameter Table 3. Canonical coefficients of discriminant analysis of
genitalia measurements
SS d.f. MS F P
Canonical variables
Area 4.5637 24 0.1902 126.8 ***
Site (area) 0.0557 25 0.0022 1.5 NS Variable First Second
Error 0.6747 450 0.0015
P -0.36 0.03
***P < 0.001; not significant (NS), P 0.05. PP -0.05 -0.07
d.f., degrees of freedom. EP -0.08 -0.20
F 0.96 -0.66
DV -0.01 0.28
positive, globular to flat keeled shell shapes through DS -0.36 0.58
intermediate shapes (Fig. 2). MG1 0.16 -1.03
Given the results of the DFA, ANOVA (Table 2) was MG2 -0.34 1.04
performed on the shell shape index ShH/MaxD and PV 0.18 -0.13
detected significant differences among populations in BCD1 0.01 0.45
BCD2 0.13 0.23
relation to area only. The post-hoc test to identify the
DBC 0.67 0.28
alternative hypothesis (H 1) distinguished four princi-
pal groups, which were named and ordered according
For abbreviations, see Fig. 1.
to increasing ShH/MaxD index (Fig. 3): flat keeled
shells, depressed intermediate shells, depressed
globular shells, and globular shells.
In the DFA of genital measurements, the first dis- analysis showed an increase in rz to a significant
criminant function accounted for 88% of the variance positive value up to the 125 km distance class (i.e. an
and the second accounted for 8% (Fig. 4). The highest increase in morphometric similarity among popula-
loadings (Table 3) on the first function were F (0.96), tions of this geographic class). Examination of all pairs
P (-0.36) and DS (-0.36). From negative to positive of populations involved in this class showed that this
scores, the first function clearly separated only the result was essentially based on populations located in
extreme globular Monte Pellegrino population from the northern chain (Madonie Mountains) (Caccamo,
the other populations. A sequential chi-square test Piano Zucchi, Gibilmanna and Isnello). Then the cor-
showed that the first function contributed to species relogram showed a progressive decrease in rz to a
2
discrimination more (c = 377, d.f. = 36, P < 0.001) significant negative value up to the 200 km distance
2
than the second function (c = 73, d.f. = 22, P < 0.001). class (i.e. a decline in morphometric similarity with
Mantel correlograms of shell shape (Fig. 5A) showed increasing geographical distance). Examination of all
slight fluctuations in the correlogram of rz close to pairs of populations involved in this class showed that
zero, which means no spatial structure. However, the they were the extreme south-eastern populations.
© 2008 The Linnean Society of London, Biological Journal of the Linnean Society, 2008, 94, 809–823
Downloaded from https://academic.oup.com/biolinnean/article-abstract/94/4/809/2701256
by guest
on 18 November 2017