
Page 6 - Fiorentino_alii_2008
P. 6
814 V. FIORENTINO ET AL.
Figure 3. Two-way analysis of variance (ANOVA) distinguishing populations on the basis of shell shape index shell
height/maximum diameter. A posteriori Tukey’s test (P < 0.05) was used to check group significance. For abbreviations,
see Appendix 1.
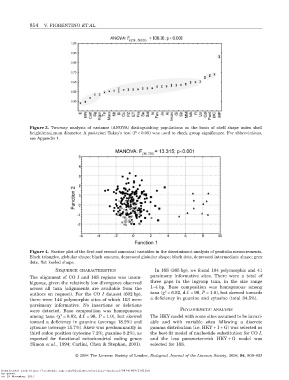
Figure 4. Scatter plot of the first and second canonical variables in the discriminant analysis of genitalia measurements.
Black triangles, globular shape; black squares, depressed globular shape; black dots, depressed intermediate shape; grey
dots, flat keeled shape.
SEQUENCE CHARACTERISTICS In 16S (365 bp), we found 104 polymorphic and 41
The alignment of CO I and 16S regions was unam- parsimony informative sites. There were a total of
biguous, given the relatively low divergence observed three gaps in the ingroup taxa, in the size range
across all taxa (alignments are available from the 1–4 bp. Base composition was homogenous among
2
authors on request). For the CO I dataset (602 bp), taxa (c = 6.52, d.f. = 96, P = 1.0), but skewed towards
there were 144 polymorphic sites of which 103 were a deficiency in guanine and cytosine (total 34.5%).
parsimony informative. No insertions or deletions
were detected. Base composition was homogeneous PHYLOGENETIC ANALYSIS
among taxa (c = 8.82, d.f. = 96, P = 1.0), but skewed The HKY model with some sites assumed to be invari-
2
toward a deficiency in guanine (average 18.2%) and able and with variable sites following a discrete
cytosine (average 15.7%). Skew was predominantly in gamma distribution (i.e. HKY + I + G) was selected as
third codon position (cytosine 7.2%; guanine 8.2%), as the best-fit model of nucleotide substitution for CO I,
expected for functional mitochondrial coding genes and the less parameter-rich HKY + G model was
(Simon et al., 1994; Carlini, Chen & Stephan, 2001). selected for 16S.
© 2008 The Linnean Society of London, Biological Journal of the Linnean Society, 2008, 94, 809–823
Downloaded from https://academic.oup.com/biolinnean/article-abstract/94/4/809/2701256
by guest
on 18 November 2017