
Page 7 - Korn_alii_2006
P. 7
M. Korn et al. • Sister species within Triops cancriformis
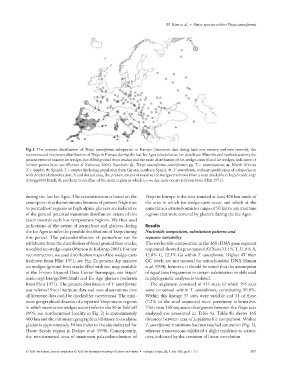
Fig. 2 The present distribution of Triops cancriformis subspecies in Europe (literature data dating back one century and own records), the
reconstructed maximum distribution of Triops in Europe during the last Ice Ages (shaded area; for details see Materials and methods section), the
present extent of massive ice wedges (ice-filled ground frost cracks) and the main distribution of ice-wedge-casts (fossil ice wedges; indicative of
former permafrost: see Murton & Kolstrup 2003). Symbols: , Triops cancriformis cancriformis; , T. c. mauritanicus; , North African
T. c. simplex; , Spanish T. c. simplex (including population from Girona, northern Spain); , T. cancriformis, without specification of subspecies or
with doubtful classification; A and dotted area, the present extent of massive ice wedges (redrawn from a map available at http://nsidc.org/
data/ggd600.html); B, southern borderline of the main region in which ice-wedge casts occur (redrawn from Flint 1971).
during the last Ice Ages. The reconstruction is based on the Triops in Europe is the area situated at least 400 km south of
assumption that the minimum distances of present Triops sites the area in which ice-wedge-casts occur and which at the
to permafrost regions or high alpine glaciers are indicative same time is situated outside a range of 50 km to any montane
of the general potential maximum distribution extent of this regions that were covered by glaciers during the Ice Ages.
taxon towards such low temperature regions. We thus used
indications of the extent of permafrost and glaciers during Results
the Ice Ages to infer the possible distribution of Triops during Nucleotide composition, substitution patterns and
this period. The palaeodistribution of permafrost can be sequence variability
withdrawn from the distribution of fossil ground frost cracks, The nucleotide composition in the 16S rDNA gene segment
so-called ice-wedge-casts (Murton & Kolstrup 2003). For our sequenced showed a pronounced AT bias (33.1% T, 31.8% A,
reconstruction, we used distribution maps of ice-wedge-casts 12.8% C, 22.3% G) within T. cancriformis. Higher AT than
(redrawn from Flint 1971; see Fig. 2), present-day massive GC levels are not unusual for mitochondrial DNA (Simon
ice wedges (ground frost cracks filled with ice; map available et al. 1994); however, it should be noted that the assumption
at the Frozen Ground Data Center homepage, see http:// of equal base frequencies in certain substitution models used
nsidc.org/data/ggd600.html) and Ice Age glaciers (redrawn in phylogenetic analyses is violated.
from Flint 1971). The present distribution of T. cancriformis The alignment consisted of 433 sites, of which 393 sites
was referred from literature data and own observations (not were conserved within T. cancriformis, constituting 90.8%.
all literature data could be checked for correctness). The mini- Within this lineage 37 sites were variable and 31 of these
mum geographical distance of a reported Triops site to regions (7.2% of the total sequence) were parsimony informative.
in which massive ice wedges occur (refer to site 86 in Vekhoff The mean 16S sequence divergences between the Triops taxa
1993; see northernmost locality in Fig. 2) is approximately analysed are presented in Table 4a. Table 4b shows 16S
400 km and the minimum geographical distance to an alpine distances between taxa of Lepidurus for comparison. Within
glacier is approximately 50 km (refer to the site indicated for T. cancriformis transitions had not reached saturation (Fig. 3),
Haute Savoie region in Defaye et al. 1998). Consequently, whereas transversions exhibited a slight tendency to satura-
the reconstructed area of maximum palaeodistribution of tion, indicated by the cessation of linear correlation.
© 2006 The Authors. Journal compilation © 2006 The Norwegian Academy of Science and Letters • Zoologica Scripta, 35, 4, July 2006, pp301–322 307