
Page 8 - Korn_alii_2006
P. 8
Sister species within Triops cancriformis • M. Korn et al.
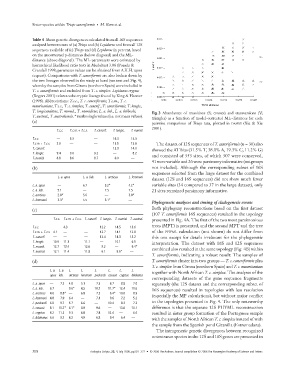
Table 4 Mean genetic divergences calculated from all 16S sequences
analysed between taxa of (a) Triops and (b) Lepidurus and from all 12S
sequences available of (c) Triops and (d) Lepidurus in percent, based
on the uncorrected p-distances (below diagonal) and the ML-
distance (above diagonal). The ML-parameters were estimated by
hierarchical likelihood ratio tests in Modeltest 3.06 (Posada &
Crandall 1998; parameter values can be obtained from A.K.H. upon
request). Comparisons with T. cancriformis are also broken down by
the two lineages observed in the study at hand (see text and Fig. 4),
whereby the samples from Girona (northern Spain) were included in
T. c. cancriformis and excluded from T. c. simplex. Lepidurus cryptus
(Rogers 2001) refers to the cryptic lineage found by King & Hanner
(1998). Abbreviations: T.c.c., T. c. cancriformis; T.c.m., T. c.
mauritanicus; T.c.s., T. c. simplex; T. cancrif., T. cancriformis; T. longic.,
T. longicaudatus; T. numid., T. numidicus; L. a. lub., L. a. lubbocki;
Fig. 3 Abundances of transitions (S; crosses) and transversions (V;
T. austral., T. australiensis. * marks single values (i.e. not mean values). triangles) as a function of model-corrected ML-distances for each
(a) pairwise comparison of Triops taxa, plotted in DAMBE (Xia & Xie
2001).
T.c.c. T.c.m. + T.c.s. T. cancrif. T. longic. T. numid.
T.c.c. — 3.3 — 16.3 14.3
T.c.m. + T.c.s. 2.9 — — 15.5 13.8 The dataset of 12S sequences of T. cancriformis (n = 30) also
T. cancrif. — — — 15.9 14.0
showed the AT bias (31.5% T, 38.0% A, 19.3% C, 11.2% G)
T. longic. 9.4 9.0 9.2 — 8.2
and consisted of 353 sites, of which 307 were conserved,
T. numid. 8.8 8.6 8.7 6.0 —
41 were variable and 26 were parsimony informative (outgroups
(b) not included). Although the corresponding subset of 16S
sequences selected from the large dataset for the combined
L. a. apus L. a. lub. L. arcticus L. lemmoni
dataset (12S and 16S sequences) did not show much fewer
L. a. apus — 6.7 3.2* 4.2* variable sites (34 compared to 37 in the large dataset), only
L. a. lub. 5.1 — 7.5 7.5 21 sites remained parsimony informative.
L. arcticus 2.8* 5.6 — 3.8*
L. lemmoni 3.3* 5.5 3.1* —
Phylogenetic analyses and timing of cladogenetic events
Both phylogeny reconstructions based on the first dataset
(c)
(107 T. cancriformis 16S sequences) resulted in the topology
T.c.c. T.c.m. + T.c.s. T. cancrif. T. longic. T. numid. T. austral. presented in Fig. 4A. The first of the two most parsimonious
trees (MPT) is presented, and the second MPT and the tree
T.c.c. — 4.3 — 12.2 14.5 13.6
T.c.m. + T.c.s. 4.1 — — 12.7 14.1 12.8 of the PHYML calculation (not shown) do not differ from
T. cancrif. — — — 12.4 14.3 13.2 this one except for details irrelevant for the phylogenetic
T. longic. 10.9 11.3 11.1 — 10.1 6.5
interpretation. The dataset with 16S and 12S sequences
T. numid. 12.7 12.4 12.6 9.2 — 9.4*
combined also resulted in the same topology (Fig. 4B) within
T. austral. 12.1 11.4 11.8 6.1 8.6* —
T. cancriformis, indicating a robust result: The samples of
(d) T. cancriformis cluster into two groups — T. c. cancriformis plus
T. c. simplex from Girona (northern Spain) and T. c. mauritanicus
L. a. L. a. L. L. L. L. L. L.
together with North African T. c. simplex. The analyses of the
apus lub. arcticus lemmoni packardi couesii cryptus bilobatus
corresponding datasets of the gene sequence fragments
L. a. apus — 7.2 4.8 5.1 7.3 8.7 8.8 7.0 separately (the 12S dataset and the corresponding subset of
L. a. lub. 6.7 — 9.6* 8.5 10.7 11.7* 12.4 10.6
16S sequences) resulted in topologies with less resolution
L. arcticus 4.6 8.8* — 6.8 7.2 6.4* 10.0 8.9
(especially the MP calculations), but without major conflict
L. lemmoni 4.8 7.9 6.4 — 7.1 9.6 7.2 5.2
to the topologies presented in Fig. 4. The only noteworthy
L. packardi 6.8 9.7 6.7 6.6 — 10.4 8.3 7.2
L. couesii 8.1 10.7* 6.1* 8.9 9.6 — 13.6 10.1 difference is that the separate 12S PHYML reconstruction
L. cryptus 8.2 11.2 9.3 6.8 7.8 12.4 — 6.6 resulted in sister group formation of the Portuguese sample
L. bilobatus 6.6 9.7 8.2 4.9 6.8 9.4 6.4 —
with the samples of North African T. c. simplex instead of with
the sample from the Spanish pond Gitanilla (Extremadura).
The intrageneric genetic divergences between recognized
notostracan species in the 12S and 16S genes are presented in
308 Zoologica Scripta, 35, 4, July 2006, pp301–322 • © 2006 The Authors. Journal compilation © 2006 The Norwegian Academy of Science and Letters