
Page 8 - LoRe_Musumeci_alii_2014
P. 8
C. Lo Re et al. / Procedia Engineering 70 ( 2014 ) 1046 – 1054 1053
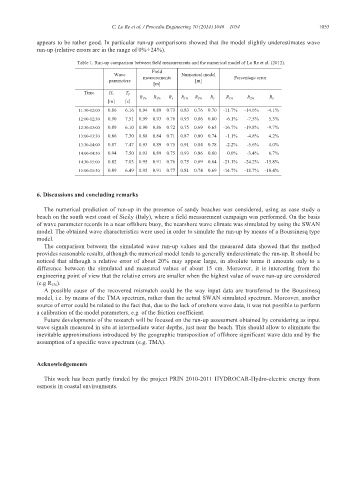
appears to be rather good. In particular run-up comparisons showed that the model slightly underestimates wave
run-up (relative errors are in the range of 0%÷24%).
Table 1. Run-up comparison between field measurements and the numerical model of Lo Re et al. (2012).
Field
Wave measurements Numerical model Percentage error
parameters [m]
[m]
Time H s T p
R 1% R 2% R s R 1% R 2% R s R 1% R 2% R s
[m] [s]
11:30-12:00 0.86 6.16 0.94 0.89 0.73 0.83 0.76 0.70 -11.7% -14.6% -4.1%
12:00-12:30 0.90 7.51 0.99 0.93 0.76 0.93 0.86 0.80 -6.1% -7.5% 5.3%
12:30-13:00 0.89 6.10 0.90 0.86 0.72 0.75 0.69 0.65 -16.7% -19.8% -9.7%
13:00-13:30 0.86 7.30 0.88 0.84 0.71 0.87 0.80 0.74 -1.1% -4.8% 4.2%
13:30-14:00 0.87 7.47 0.93 0.89 0.75 0.91 0.84 0.78 -2.2% -5.6% 4.0%
14:00-14:30 0.94 7.50 0.93 0.89 0.75 0.93 0.86 0.80 0.0% -3.4% 6.7%
14:30-15:00 0.82 7.03 0.95 0.91 0.76 0.75 0.69 0.64 -21.1% -24.2% -15.8%
15:00-15:30 0.89 6.49 0.95 0.91 0.77 0.81 0.74 0.69 -14.7% -18.7% -10.4%
6. Discussions and concluding remarks
The numerical prediction of run-up in the presence of sandy beaches was considered, using as case study a
beach on the south west coast of Sicily (Italy), where a field measurement campaign was performed. On the basis
of wave parameter records in a near offshore buoy, the nearshore wave climate was simulated by using the SWAN
model. The obtained wave characteristics were used in order to simulate the run-up by means of a Boussinesq type
model.
The comparison between the simulated wave run-up values and the measured data showed that the method
provides reasonable results, although the numerical model tends to generally underestimate the run-up. It should be
noticed that although a relative error of about 20% may appear large, in absolute terms it amounts only to a
difference between the simulated and measured values of about 15 cm. Moreover, it is interesting from the
engineering point of view that the relative errors are smaller when the highest value of wave run-up are considered
(e.g R 1%).
A possible cause of the recovered mismatch could be the way input data are transferred to the Boussinesq
model, i.e. by means of the TMA spectrum, rather than the actual SWAN simulated spectrum. Moreover, another
source of error could be related to the fact that, due to the lack of onshore wave data, it was not possible to perform
a calibration of the model parameters, e.g of the friction coefficient.
Future developments of the research will be focused on the run-up assessment obtained by considering as input
wave signals measured in situ at intermediate water depths, just near the beach. This should allow to eliminate the
inevitable approximations introduced by the geographic transposition of offshore significant wave data and by the
assumption of a specific wave spectrum (e.g. TMA).
Acknowledgements
This work has been partly funded by the project PRIN 2010-2011 HYDROCAR-Hydro-electric energy from
osmosis in coastal environments.