
Page 5 - LoRe_Musumeci_alii_2014
P. 5
1050 C. Lo Re et al. / Procedia Engineering 70 ( 2014 ) 1046 – 1054
The beach topographic survey, necessary for the subsequent processing, was focused on measuring the
following beach morphological features: the dune scarp line, the berm above sea level and the transect showed in
Fig. 4. The slope was determined and then used for assessing the effects of wave motion on the position of the
instantaneous land-sea boundary. Bathymetric information 5 m below mean water level were obtained by a nautical
map and measurements provided by the Istituto Idrografico della Marina Militare Italiana (Hydrographic Institute
of the Italian Navy). The sediment analysis allowed the topographic survey slopes to be compared with those
usually indicated in the literature for the granulometric data collected.
3.2. Run-up measurements
The run-up on beaches may be measured in different ways depending on the general aim and on the required
precision. Records of the water line positions can in principle be obtained by resistance run-up meters or by video-
cameras. The technique applied in the present study is based on a monitoring video system. In particular, positions
of the swash are measured on transects across the beach, normal to the shore. In each transect a line was built using
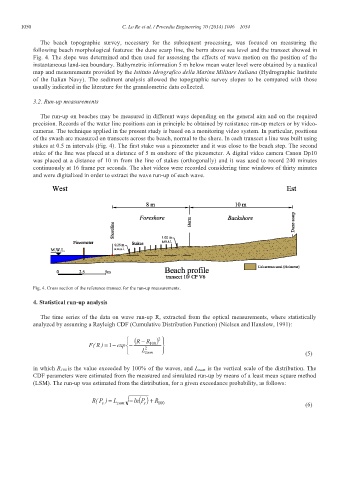
stakes at 0.5 m intervals (Fig. 4). The first stake was a piezometer and it was close to the beach step. The second
stake of the line was placed at a distance of 5 m onshore of the piezometer. A digital video camera Canon Dp10
was placed at a distance of 10 m from the line of stakes (orthogonally) and it was used to record 240 minutes
continuously at 16 frame per seconds. The shot videos were recorded considering time windows of thirty minutes
and were digitalized in order to extract the wave run-up of each wave.
Fig. 4. Cross section of the reference transect for the run-up measurements.
4. Statistical run-up analysis
The time series of the data on wave run-up R, extracted from the optical measurements, where statistically
analyzed by assuming a Rayleigh CDF (Cumulative Distribution Function) (Nielsen and Hanslow, 1991):
⎧ ( − RR ) ⎪
⎫
2
⎪
F ( R ) =1 − exp ⎨ − 2 100 ⎬
⎩
⎭
⎪ L zwm ⎪ (5)
in which R 100 is the value exceeded by 100% of the waves, and L zwm is the vertical scale of the distribution. The
CDF parameters were estimated from the measured and simulated run-up by means of a least mean square method
(LSM). The run-up was estimated from the distribution, for a given exceedance probability, as follows:
( R P ) = L − ln () RP +
s zwm s 100 (6)