
Page 3 - MedSens_index_2021
P. 3
Ecological Indicators 122 (2021) 107296
E. Turicchia et al.
Table 1 Table 2
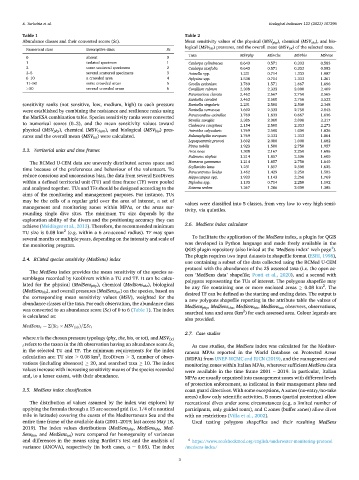
Abundance classes and their converted scores (Sc). Mean sensitivity values of the physical (MSV phy ), chemical (MSV che ), and bio-
logical (MSV bio ) pressures, and the overall mean (MSV tot ) of the selected taxa.
Numerical class Descriptive class Sc
Taxa MSVphy MSVche MSVbio MSVtot
0 absent 0
1 isolated specimen 1 Caulerpa cylindracea 0.643 0.571 0.333 0.583
2 some scattered specimens 2 Caulerpa taxifolia 0.643 0.571 0.333 0.583
3–5 several scattered specimens 3 Axinella spp. 1.231 0.714 1.333 1.087
6–10 a crowded area 4 Aplysina spp. 1.538 0.714 1.333 1.261
11–50 some crowded areas 5 Geodia cydonium 1.769 1.571 1.667 1.696
>50 several crowded areas 6 Corallium rubrum 2.308 2.333 3.000 2.409
Paramuricea clavata 2.462 2.667 2.750 2.565
Eunicella cavolini 2.462 2.500 2.750 2.522
sensitivity ranks (not sensitive, low, medium, high) to each pressure Eunicella singularis 2.231 2.500 2.500 2.348
were established by combining the resistance and resilience ranks using Eunicella verrucosa 1.692 2.333 2.750 2.043
the MarESA combination table. Species sensitivity ranks were converted Parazoanthus axinellae 1.769 1.833 0.667 1.636
Savalia savaglia 2.385 2.000 2.000 2.217
to numerical scores (0–3), and the mean sensitivity values toward Cladocora caespitosa 2.154 2.500 2.333 2.273
physical (MSV phy ), chemical (MSV chem ), and biological (MSV bio ) pres- Astroides calycularis 1.769 2.500 1.000 1.826
sures and the overall mean (MSV tot ) were calculated. Balanophyllia europaea 1.769 2.333 1.333 1.864
Leptopsammia pruvoti 1.692 2.000 1.000 1.682
Pinna nobilis 1.923 1.500 2.750 1.957
2.3. Territorial units and time frames Arca noae 1.308 2.167 2.250 1.696
Palinurus elephas 1.214 1.857 2.500 1.600
The RCMed U-CEM data are unevenly distributed across space and Homarus gammarus 1.214 1.857 2.750 1.640
Scyllarides latus 1.231 1.857 2.500 1.625
time because of the preferences and behaviour of the volunteers. To
Paracentrotus lividus 1.462 1.429 2.250 1.583
reduce conscious and unconscious bias, the data from several EcoDivers Hippocampus spp. 1.933 1.143 2.250 1.769
within a defined territorial unit (TU) and time frame (TF) were pooled Diplodus spp. 1.133 0.714 2.250 1.192
and analysed together. TUs and TFs should be designed according to the Sciaena umbra 1.267 1.286 2.000 1.385
aims of the monitoring and management purposes. For instance, TUs
may be the cells of a regular grid over the area of interest, a set of values were classified into 5 classes, from very low to very high sensi-
management and monitoring zones within MPAs, or the areas sur-
tivity, via quintiles.
rounding single dive sites. The minimum TU size depends by the
exploration ability of the divers and the positioning accuracy they can
2.6. MedSens index calculator
achieve (Meidinger et al., 2013). Therefore, the recommended minimum
2
TU size is 0.08 km (e.g. within a 6 arc-second radius). TF may span
To facilitate the application of the MedSens index, a plugin for QGIS
several months or multiple years, depending on the intensity and scale of
the monitoring program. was developed in Python language and made freely available in the
4
QGIS plugin repository (also linked at the ‘MedSens index’ web page ).
The plugin requires two input datasets in shapefile format (ESRI, 1998),
2.4. RCMed species sensitivity (MedSens) index
one containing a subset of the data collected using the RCMed U-CEM
protocol with the abundances of the 25 assessed taxa (i.e. the open ac-
The MedSens index provides the mean sensitivity of the species as-
cess ‘MedSens data’ shapefile; Ponti et al., 2020), and a second with
semblages recorded by EcoDivers within a TU and TF. It can be calcu-
polygons representing the TUs of interest. The polygons shapefile may
lated for the physical (MedSens phy ), chemical (MedSens che ), biological 2
be any file containing one or more enclosed areas ≥ 0.08 km . The
(MedSens bio ), and overall pressures (MedSens tot ) on the species, based on
desired TF can be defined as the starting and ending dates. The output is
the corresponding mean sensitivity values (MSV), weighted for the
a new polygons shapefile reporting in the attribute table the values of
abundance classes of the taxa. For each observation, the abundance class MedSens phy , MedSens che , MedSens bio , MedSens tot , observers, observations,
was converted to an abundance score (Sc) of 0 to 6 (Table 1). The index 2
searched taxa and area (km ) for each assessed area. Colour legends are
is calculated as:
also provided.
MedSens x = Σ(Sc i × MSV (x)i )/ΣSc i
2.7. Case studies
where x is the chosen pressure typology (phy, che, bio, or tot), and MSV (x)
i refers to the taxon in the ith observation having an abundance score Sc i As case studies, the MedSens index was calculated for the Mediter-
in the selected TU and TF. The minimum requirements for the index ranean MPAs reported in the World Database on Protected Areas
2
calculation are: TU size ≥ 0.08 km , EcoDivers ≥ 3, number of obser- (WDPA) from UNEP-WCMC and IUCN (2019), and the management and
vations (including absences) ≥ 20, and searched taxa ≥ 10. The index monitoring zones within Italian MPAs, wherever sufficient MedSens data
values increase with increasing sensitivity means of the species recorded
were available in the time frame 2001 – 2019. In particular, Italian
and, to a lesser extent, with their abundance. MPAs are usually organised into management zones with different levels
of protection enforcement, as indicated in their management plans and
2.5. MedSens index classification coast guard directives. With some exceptions, A zones (no-entry/no-take
areas) allow only scientific activities, B zones (partial protection) allow
The distribution of values assumed by the index was explored by recreational dives under some circumstances (e.g. a limited number of
applying the formula through a 15 arc-second grid (i.e. 1/4 of a nautical participants, only guided tours), and C zones (buffer zones) allow dives
mile in latitude) covering the coasts of the Mediterranean Sea and the with no restrictions (Villa et al., 2002).
entire time frame of the available data (2001–2019; last access May 18, Used testing polygons shapefiles and their resulting MedSens
2019). The index values distributions (MedSens phy , MedSens che , Med-
Sens bio , and MedSens tot ) were compared for homogeneity of variances
and differences in the means using Bartlett’s test and the analysis of 4 https://www.reefcheckmed.org/english/underwater-monitoring-protocol
variance (ANOVA), respectively (in both cases, α = 0.05). The index /medsens-index/
3