
Page 103 - Panuccio2012
P. 103
Southbound direction of colonization of Short-toed Snake Eagle
located over three “zones” of 6 degrees in latitude, using personal observations about nest location.
at the transition from one zone to another the In the atlas the presence of species in each sample
grid has a compression and rotation of squares so unit is listed in three ways: certain, probable and
some of them (less than 5% of the total) have an possible. In this study we considered only the first
area less than 10 Km2. To avoid effects due to the two categories to assign a value of presence. In
difference in size among cells, we used variables most case the grid used in the atlas is the same we
that are not dependent on the cell surface but that used, when atlas’ grid was smaller than ours, we
referred to them in terms of percentage coverage. assign presence value to our cell if at least one of
The same grid was used in the atlas of reptiles and the atlas cell was comprised in our sampling units.
amphibians of Italy (Sindaco et al. 2006) we used At the end of data collecting we had 94 cells with
to test prey availability (reptiles species richness). presence data.
Presence data of Short-toed Eagle Predictive variables:
Short-toed Snake Eagle presence data was obtained At first we considered 30 environment variables
by consulting several atlas of bird distribution grouped into 5 categories (Tab. 1): land use,
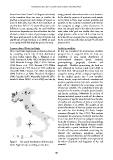
in some Italian regions (Fig. 1, Mingozzi et al. availability of prey, spatial distribution of
1988, Frassinet & Kalby 1989, Brichetti & Fasola environmental elements (patch analysis),
1990, Meschini & Frugis 1993, G.V.S.O. Nisoria geomorphology, geography (latitude and
1994, Boano et al. 1995, Ravasini 1995, Tellini longitude). Variables representing the land use
Florenzano et al. 1997, Bon et al. 1999, Gellini & were obtained by Corinne Land Cover 2000 to
Ceccarelli 2000, Fracasso et al. 2003, Bordignon the third level. We grouped first those land use
2004, Pedrini et al. 2005, Bionda & Bordignon categories having similar ecological significance
2006, Giacchini 2007, Mezzavilla & Bettiol 2007, for the studied species into 7 new variables:
Ientile & Massa 2008, La Gioia 2009) and also by forests, shrubs, crops and orchards, meadows and
pastures, populated areas, bare rock, wetlands. For
Figure 1 - The actual distribution of Short-toed each cell we calculated the percentage coverage
Snake Eagle in Italy, according to atlas data. of land use variables. The availability of prey was
measured as the number of reptile species (snakes
and lizards excluding Gekkonidae for its lack of
daytime activities) present in each cell, the data on
the presence of reptiles were derived from the atlas
of reptiles and amphibians of Italy as mentioned
above (Sindaco et al. 2006). The analysis of the
spatial distribution of land use patches was carried
out with the Esri ArcMap 9.2 Patch Analyst
extension (Rempel & Carr 1999). This analysis
investigates the geometry of selected patches that
in our case were the land use polygon and gives
back a list of statistics. Data on the geomorphology
were derived from DEM (digital elevation model)
of Italy with a spatial resolution of 250 meters.
In each cell they were calculated concerning the
altitude: the minimum, maximum, average,
median, standard deviation and the coefficient of
variation. Geographical variables were represented
by values of latitude and longitude of the cell
centroid.
103