
Page 106 - Panuccio2012
P. 106
Southbound direction of colonization of Short-toed Snake Eagle
Table 3 - Results of the Model A and Model B showing the Wald statistic and probability
(significance).
Model A Model B
B Wald Sig. B Wald Sig.
Latitude 0,000 20,655 0,000 - - -
Mean -0,001 1,943 0,163 -0,002 3,453 0,063
Altitude 0,000 3,280 0,070 0,000 8,125 0,004
10,547 22,306 0,000 10,960 24,842 0,000
(Mean -8,895 13,975 0,000 -8,390 12,763 0,000
Altitude)² 0,185 19,102 0,000 0,212 28,727 0,000
1,937 2,785 0,095 -488,816 0,061 0,805
Proportion -534,33 0,766 0,399
of Forest 0,381 187,219 0,710
201,555 0,738 0,402
(Proportion 0,390 0,308 0,704
of Forest)²
Number
of reptile
species
Proportion
of Shrubs
Mean Patch
Fractal
Dimension
(Mean Patch
Fractal
Dimension) ²
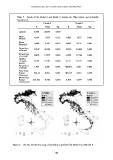
Figure 2 – The two distribution map of suitability as predicted by Model A and Model B.
106