
Page 105 - Panuccio2012
P. 105
Southbound direction of colonization of Short-toed Snake Eagle
Where n is the total number of observations. software gives good results also when working
We carried out a first set of models testing different with small samples (Pearson et al. 2007) as in our
combination of variables and subsequently we case, and it’s considered to be particularly effective
performed again the same runs but in this case among those similarly available (Guisan et al.
with the exclusion of geographical variable 2007). 10010 points were used to determine the
“Y_CENTR” to delete the effect of latitude Maxent distribution (backgrounds and presence
in the explanation of species preferences. At points).
the end we obtained a value of probability of Results
presence comprising between 0 and 1 for each Variables that were not correlated inside the same
cell that varies depending on the model and we group of variables and those we used to run the
used this difference to compare model including logistic regression are showed in Table 2. Best
“Y_CENTR” and the same model without this model (Model A) reached the lower value of AICc
variable. (432,46) comprising 9 variables (Tab. 3). This
In a second phase of this work we generated model reached an overall value of correct percentage
a map of habitat suitability for the species with of 77,7% (84,1% for absence and 64,9% for
Maxent software (Phillips & Dudík 2008) presence). AUC value of ROC curve is 0,848. We
using presence-only data. For this analysis we tested the same model without latitudinal value;
used exact localization of nests (n=10) and four this second model (Model B) showed a higher
environmental variables in raster format with a AICc value (453,02) and comprised 8 variables
spatial resolution of 250x250 meters. Variables (Tab. 3). This model reached an overall value of
used in this analysis were: Corine land cover correct percentage of 74,5% (81,5% for absence
2000 (level III), Elevation (mean altitude of raster and 60,4% for presence), AUC value of ROC
pixel), Aspect (mean exposure of raster pixel) and curve is 0,824. Using the results of these two
Slope (mean grade line of raster pixel). Raster models we realized two different distribution maps
files were performed with ESRI ArcMap 9.2 from of suitability. Considering Model A that includes
same CLC layer and DEM used in RegLog but in latitude as a variable, the potential distribution of
this case we didn’t group any land cover category Short-toed Snake Eagles is restricted to central and
because analysis scale was lower. Use of Maxent northern Italy (Fig. 2). Differently the Model B,
was preferred in this kind of analysis because this
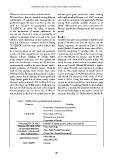
Table 2 - Variables used to perform logistic regression.
Category Variables
Proportion of meadows and pastures
Proportion of crops and orchards
LAND USE Proportion of Forests
(Proportion of Forests)2
Proportion of Shrubs
AVAILABILITY OF PREY Number of reptile species (Snakes and Lizards)
SPATIAL DISTRIBUTION Mean Patch Edge
OF ENVIRONMENTAL Mean Patch Fractal Dimension
ELEMENTS (LAND USE – (Mean Patch Fractal Dimension)2
Mean Altitude
PATCH ANALYSIS) (Mean Altitude)2
GEOMORFHOLOGY
GEOGRAPHY Latitude
105