
Page 4 - Passalacqua_Peruzzi_Pellegrino2008
P. 4
Passalacqua & al. • Biosystematics of the Jacobaea maritima group TAXON 57 (3) • August 2008: 893–906
A molecular clock approach to our sequence data was material and four from dried material. Leaf characters
not possible, because fossils are not known from Jacobaea were studied by scanning, by standardising the images,
or any closely related lineages. However, we compared and by measuring the images (perimeter, area, length,
the amount of nrDNA ITS divergence among taxa in the maximum width) through the GIS software Idrisi 4.1
light of calibrated ITS rates calculated for the Asteraceae (Eastman, 1992). Three other variables were added (de-
(Oberprieler, 2005 and references therein). rived variables, Table 3): (1) leaf perimeter index (Pi)
ISSR analysis. — Ten 5′-anchored primers based on = perimeter of leaf/perimeter of enclosing rectangle (i.e.,
dinucleotide repeats were utilised. The ISSR reactions 2 × leaf length + 2 × leaf width); (2) leaf area index (Ai)
were performed in an automated cycler (PTC-100, MJ = area of leaf/area of enclosing rectangle (i.e., leaf length
Research, Watertown, MA, U.S.A.) programmed for a × leaf width); and (3) leaf segmentation index (Si) = Pi/Ai.
10 min denaturation step followed by 35 cycles of 30 s at Three leaf segmentation types were recognised based
95°C, 45 s at 60°C, 120 s at 72°C as well as a final elon- on distance from the referent rib of the sinus margin blade
gation cycle of 7 min at 72°C. After amplification, 2.5 μl to that of the segment apex (referent rib = main vein for
of loading dye (0.25% bromophenol blue, 0.25% xylene the primary segments; primary segment main vein for
cyanol) was added to each reaction tube. PCR products the secondary ones; and secondary segment main vein
were electrophoresed in 1.8% MetaPhor agarose (FMC for the tertiary ones): < 0.3 = septate; 0.3 to 0.7 = partite;
BioProducts, Maine, U.S.A.) gels with 0.5 μg/ml of ethid- > 0.7 = lobed (Fig. 1).
ium bromide in TAE buffer at 80 V for 2 hours. A 1 kb The data matrix was analysed with Data Desk 6.1
DNA ladder (SIGMA) was also loaded on the gel as size (Velleman, 1997), Syn-Tax (Podani, 2001), and SPSS 14.0
standard. The gels were then visualised under UV light
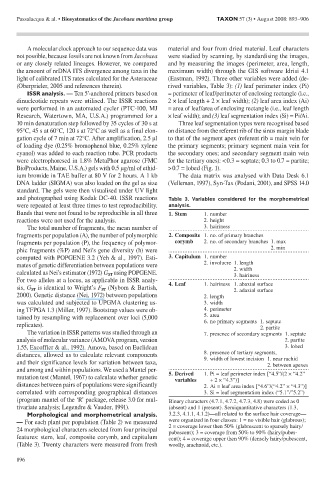
and photographed using Kodak DC-40. ISSR reactions Table 3. Variables considered for the morphometrical
were repeated at least three times to test reproducibility. analy sis.
Bands that were not found to be reproducible in all three 1. Stem 1. number
reactions were not used for the analysis. 2. height
The total number of fragments, the mean number of 3. hairiness
fragments per population (A), the number of polymorphic 2. Composite 1. no. of primary branches
fragments per population (P), the frequency of polymor- corymb 2. no. of secondary branches 1. max
phic fragments (%P) and Nei’s gene diversity (h) were 2. min
computed with POPGENE 3.2 (Yeh & al., 1997). Esti- 3. Capitulum 1. number
mates of genetic differentiation between populations were 2. involucre 1. length
calculated as Nei’s estimator (1972) G STST using POPGENE. 2. width
3. hairiness
For two alleles at a locus, as applicable in ISSR analy-
sis, G STST is identical to Wright’s F STST (Nybom & Bartish, 4. Leaf 1. hairiness 1. abaxial surface
2. adaxial surface
2000). Genetic distance (Nei, 1972) between populations 2. length
was calculated and subjected to UPGMA clustering us- 3. width
ing TFPGA 1.3 (Miller, 1997). Bootstrap values were ob- 4. perimeter
tained by resampling with replacement over loci (5,000 5. area
replicates). 6. no primary segments 1. septate
2. partite
The variation in ISSR patterns was studied through an 7. presence of secondary segments 1. septate
analysis of molecular variance (AMOVA program, version 2. partite
1.55, Excoffier & al., 1992). Amova, based on Euclidean 3. lobed
distances, allowed us to calculate relevant components 8. presence of tertiary segments,
and their significance levels for variation between taxa, 9. width of lowest incision 1. near rachid
2. between apexes
and among and within populations. We used a Mantel per-
mutation test (Mantel, 1967) to calculate whether genetic 5. Derived 1. Pi = leaf perimeter index [“4.5”/(2 × “4.2”
variables
+ 2 × “4.3”)]
distances between pairs of populations were significantly 2. Ai = leaf area index [“4.6”/(“4.2” × “4.3”)]
correlated with corresponding geographical distances 3. Si = leaf segmentation index (“5.1”/”5.2”)
(program mantel of the ‘R’ package, release 3.0 for mul- Binary characters (4.7.1, 4.7.2, 4.7.3, 4.8) were coded as 0
tivariate analysis; Legendre & Vaudor, 1991). (absent) and 1 (present). Semiquantitative characters (1.3,
Morphological and morphometrical analysis. 3.2.3, 4.1.1, 4.1.2)—all related to the surface hair coverage—
— For each plant per population (Table 2) we measured were organized in four classes: 1 = no visible hair (glabrous);
24 morphological characters selected from four principal 2 = coverage lower then 50% (glabrescent to sparsely hairy/
pubescent); 3 = coverage from 50% to 90% (hairy/pubes-
features: stem, leaf, composite corymb, and capitulum cent); 4 = coverage upper then 90% (densely hairy/pubescent,
(Table 3). Twenty characters were measured from fresh woolly, arachnoid, etc.).
896