
Page 6 - Passalacqua_Peruzzi_Pellegrino2008
P. 6
Passalacqua & al. • Biosystematics of the Jacobaea maritima group TAXON 57 (3) • August 2008: 893–906
among populations. There is considerable genetic variation Morphological and morphometrical analysis.
(69.46%) among populations, but only 30.54% among indi- — For a similarity overview throughout all populations,
viduals within populations. When populations are grouped we computed a Principal Coordinate Analysis (PCoA) of
on the basis of their taxa, genetic variation among taxa 22 characters. Some characters were excluded because
(74.12%) is much higher than that within taxa (15.15%) they proved not to be useful in terms of distinguishing
and within a population (10.73%), suggesting that genetic populations by significance tests (presence of secondary
2
differentiation occurs mainly among species rather than septate leaf segments, χ = 7.079 P = 0.528; presence of
2
among populations. secondary lobed leaf segments, χ = 12.203 P = 0.142;
The UPGMA dendrogram (Fig. 3) reveals one separate stem number, H = 7.2 P = 0.520). Moreover, we selected
group including J. maritima s.l. In this group the small- the Segmentation index (H = 87.702) and then the two
est divergence is observed between J. bicolor (pop. 5) and dependent characters, Perimeter index (H = 68.612) and
J. gibbosa (pop. 6), while the greatest divergence is between Area index (H = 58.468), were excluded.
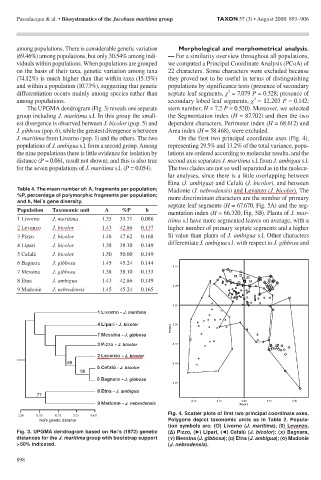
J. maritima from Livorno (pop. 1) and the others. The two On the first two principal coordinate axes (Fig. 4),
populations of J. ambigua s.l. form a second group. Among representing 29.5% and 13.2% of the total variance, popu-
the nine populations there is little evidence for isolation by lations are ordered according to molecular results, and the
distance (P = 0.061, result not shown), and this is also true second axis separates J. maritima s.l. from J. ambigua s.l.
for the seven populations of J. maritima s.l. (P = 0.054). The two clades are not so well separated as in the molecu-
lar analyses, since there is a little overlapping between
Etna (J. ambigua) and Cefalù (J. bicolor), and between
Table 4. The mean number of: A, fragments per population; Madonie (J. nebrodensis) and Levanzo (J. bicolor). The
%P, percentage of polymorphic fragments per population; more discriminant characters are the number of primary
and h, Nei’s gene diversity.
septate leaf segments (H = 67.670, Fig. 5A) and the seg-
Population Taxonomic unit A %P h
mentation index (H = 66.320, Fig. 5B). Plants of J. mar-
1 Livorno J. maritima 1.35 35.71 0.086 itima s.l have more segmented leaves on average, with a
2 Levanzo J. bicolor 1.43 42.86 0.137 higher number of primary septate segments and a higher
3 Pizzo J. bicolor 1.48 47.62 0.168 Si value than plants of J. ambigua s.l. Other characters
differentiate J. ambigua s.l. with respect to J. gibbosa and
4 Lipari J. bicolor 1.38 38.10 0.149
5 Cefalù J. bicolor 1.50 50.00 0.149
6 Bagnara J. gibbosa 1.45 45.24 0.144
7 Messina J. gibbosa 1.38 38.10 0.133
8 Etna J. ambigua 1.43 42.86 0.149
9 Madonie J. nebrodensis 1.45 45.24 0.165
Fig. 4. Scatter plots of first two principal coordinate axes.
Polygons depict taxonomic units as in Table 2. Popula-
tion symbols are: (O) Livorno (J. maritima); (0) Levanzo,
Fig. 3. UPGMA dendrogram based on Nei’s (1972) genetic (Δ) Pizzo, (►) Lipari, (◄) Cefalù (J. bicolor); (X) Bagnara,
distances for the J. maritima group with bootstrap support (Y) Messina (J. gibbosa); (□) Etna (J. ambigua); (◊) Madonie
> 50% indicated. (J. nebrodensis).
898