
Page 7 - Passalacqua_Peruzzi_Pellegrino2008
P. 7
TAXON 57 (3) • August 2008: 893–906 Passalacqua & al. • Biosystematics of the Jacobaea maritima group
J. bicolor, such as a larger capitulum (H = 41.480, Table
5) and a pubescent to somewhat arachnoid (J. ambigua)
or grey tomentose (J. nebrodensis) abaxial leaf surface
(H = 30.846, Table 6), but not from J. maritima and Le-
vanzo, which show a similar variability range. Moreover,
J. ambigua s.l. tend to have a lower minimum number of
secondary corymb branches (H = 34.661, Table 5).
For J. ambigua s.l., Etna (J. ambigua) and Madonie
(J. nebrodensis) have a good degree of distinctiveness on
the first axis. Jacobaea ambigua has a lower overall hair
coverage (Table 6; leaf adaxial surface, H = 28.333; leaf
abaxial surface, H = 22.414; stem, H = 15.839) and taller
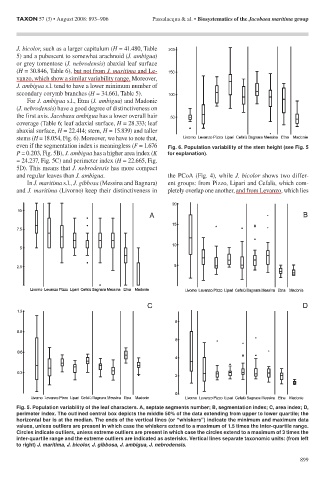
stems (H = 18.054, Fig. 6). Moreover, we have to note that,
even if the segmentation index is meaningless (F = 1.676 Fig. 6. Population variability of the stem height (see Fig. 5
P = 0.203, Fig. 5B), J. ambigua has a higher area index (K for explanation).
= 24.237, Fig. 5C) and perimeter index (H = 22.665, Fig.
5D). This means that J. nebrodensis has more compact
and regular leaves than J. ambigua. the PCoA (Fig. 4), while J. bicolor shows two differ-
In J. maritima s.l., J. gibbosa (Messina and Bagnara) ent groups: from Pizzo, Lipari and Cefalù, which com-
and J. maritima (Livorno) keep their distinctiveness in pletely overlap one another, and from Levanzo, which lies
Fig. 5. Population variability of the leaf characters. A, septate segments number; B, segmentation index; C, area index; D,
perimeter index. The outlined central box depicts the middle 50% of the data extending from upper to lower quartile; the
horizontal bar is at the median. The ends of the vertical lines (or “whiskers”) indicate the minimum and maximum data
values, unless outliers are present in which case the whiskers extend to a maximum of 1.5 times the inter-quartile range.
Circles indicate outliers, unless extreme outliers are present in which case the circles extend to a maximum of 3 times the
inter-quartile range and the extreme outliers are indicated as asterisks. Vertical lines separate taxonomic units: (from left
to right) J. maritima, J. bicolor, J. gibbosa, J. ambigua, J. nebrodensis.
899