
Page 3 - SCIALABBA_ali_2010
P. 3
628 A. Scialabba et al.
bis(trimethylsilyl) trifluoroacetamide (BSTFA) and analyses of Toc and phytosterols, column tempera-
incubating at 70°C for 40 min (Grob & Barry 2004). ture was held at 220°C for 1 min after injection, then
−1
Analyses were performed using a CP 3800 gas raised to 290°C at 5°C min and held for 10 min.
chromatograph (Varian, Walnut Creek, CA, USA) The mass range was 450 m/z and 520 m/z. For
coupled with a Saturn 2000 ion trap mass spectrom- analyses of fatty acids, the column was held at 100°C
−1
eter (Varian, Walnut Creek, CA, USA) operating in for 1 min, then raised to 300°C at 20°C min and
electron ionisation mode (70 eV). A 0.5-µL aliquot held for 10 min. The mass range was scanned from
of each sample was injected. An Rtx-5 (Restek 250 m/z to 550 m/z. Calibration curves for Toc, FA
Corporation, Bellefonte, PA, USA) capillary column and phytosterols were plotted by injecting α-, γ- and
(30 m × 0.25 mm ID × 250 µm film thickness) was δ-Toc, n-pentadecanoic acid and cholesterol, all
−1
used. The carrier gas was helium at 1 mL min . solubilised in n-hexane. All the standards were
Injector temperature was 280°C for all analyses. A purchased from Sigma Chemicals. The quantitative
−1
split ratio of 1:10 was used for each injection. For data were expressed in mg kg DW.
−1
Table II. Tocopherol content and composition (mean mg kg DW ± standard deviation) of Brassica seeds. T, tocopherol; T-Toc, total
tocopherol. Means within a column followed by the same letter do not differ significantly at P ≤ 0.05 as determined by Tukey’s test.
Code α-T γ-T δ-T T-Toc
B1 110.2 ± 9.6 ab 96.4 ± 18.2 ab 1.1 ± 0.2 A 207.8 ± 22.2 ab
B2 122.8 ± 16.1 Ab 130.5 ± 22.7 ab 2.1 ±1 .1 ab 255.4 ± 16.1 b
Downloaded By: [Scialabba, A.] At: 20:01 10 October 2010
B3 143.9 ± 15.8 bc 450.0 ± 54.8 e 3.9 ± 0.7 cd 597.8 ± 54.1 d
B4 170.5 ± 18.9 d 354.1 ± 45.3 de 3.3 ± 0.3 bc 527.9 ± 42.9 d
B5 90.7 ± 8.0 a 129.8 ± 20.9 ab 1.8 ± 0.4 ab 222.2 ± 18.4 b
B6 185.1 ± 20.3 d 353.8 ± 43.1 de 2.4 ± 0.4 bc 541.3 ± 30.6 d
B7 159.2 ± 16.8 c 265.3 ± 41.4 cd 2.6 ± 0.5 bc 427.1 ± 33.9 c
B8 174.1 ± 19.2 d 183.6 ± 26.6 bc 1.5 ± 0.1 ab 359.2 ± 45.2 c
B9 79.6 ± 5.7 a 40.5 ± 11.1 a 5.0 ± 1.1 D 125.1 ± 13.6 a
B1. B. rupestris Raf. subsp. rupestris, B2. B. rupestris subsp. hispida Raimondo & Mazzola, B3. B. villosa Biv. subsp. villosa, B4. B. villosa
subsp. bivonana (Mazzola & Raimondo) Raimondo & Mazzola, B5. B. villosa subsp. brevisiliqua (Raimondo & Mazzola) Raimondo &
Mazzola, B6. B. villosa subsp. drepanensis (Caruel) Raimondo & Mazzola, B7. B. villosa subsp. tinei (Lojac.) Raimondo & Mazzola, B8.
B. incana Ten., B9. B. macrocarpa Guss.
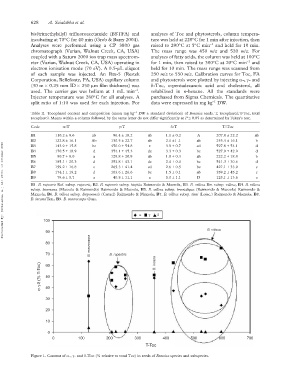
Figure 1. Content of α-, γ- and δ-Toc (% relative to total Toc) in seeds of Brassica species and subspecies.