
Page 4 - SCIALABBA_ali_2010
P. 4
Biochemical analysis of Brassica seeds 629
Statistical analysis ab a ab b ab b a c ab
The Satistica package (Stat Soft) was used for statis-
tical analyses. The analytical evaluation of Toc, fatty
acid and phytosterol content was repeated three T-FA 1878.7 ± 35.7 1722.2 ± 73.5 1876.7 ± 39.0 1968.1 ± 63.7 1853.8 ± 40.3 1991.9 ± 58.5 1765.4 ± 74.6 2761.5 ± 123.1 1835.3 ± 82.0
times. Mean values ± standard deviations were calcu-
lated. One-way analysis of variance (ANOVA) was
performed to identify significant differences between
accessions. A post hoc Tukey multiple range test was
used to identify homogeneous groups at P ≤ 0.05.
Correlation analyses were determined using the Pear- C 22:1 268.32 ± 21.2 229.48 ± 19.6 296.78 ± 14.7 267.64 ± 19.5 214.82 ± 18.7 292.14 ± 18.6 215.53 ± 18.6 618.29 ± 32.6 311.62 ± 24.7
son coefficient at a significance level P ≤ 0.05. For
each taxon, the percentage of α-, γ- and δ-Toc content
was calculated relative to total tocopherols (T-Toc).
C 22:0 157.35 ± 11.20 162.53 ± 15.1 160.25 ± 11.3 167.95 ± 12.2 149.77 ± 14.3 158.68 ± 10.6 160.18 ± 16.3 155.99 ± 14.9 157.39 ± 11.1
Results
The biochemical analysis of dry seeds showed that
in the nine specific and intraspecific taxa examined,
α- and γ-Toc were the major isomers; δ-Toc was
Downloaded By: [Scialabba, A.] At: 20:01 10 October 2010
present in traces and β-Toc was never found (Table C 20:1 167.69 ± 10.6 164.67 ± 17.6 179.33 ± 12.4 156.42 ± 13.7 165.46 ± 17.8 252.28 ± 18.3 169.30 ± 16.4
II). All the differences for total and individual Toc 162.51 ± 9.9 156.75 ± 9.8
detected among the Brassica accessions were highly
significant for α-Toc (F (8,18) = 19.1; P ≤ 0.00001),
γ-Toc (F (8,18) = 48.5; P ≤ 0.00001), δ-Toc (F (8,18) =
13.7; P ≤ 0.00003) and T-Toc (F (8,18) = 76.2; P ≤
0.00001). The T-Toc, α-Toc and γ-Toc contents in C 20:0 162.61 ± 7.8 164.31 ± 15.5 168.46 ± 13.2 175.79 ± 16.8 159.05 ± 13.5 166.93 ± 13.3 163.95 ± 13.9 194.77 ± 16.9 163.69 ± 15.8
the B3–B7 populations (represented by the B. villosa
group), with the exception of B5 (B. villosa subsp. Table III. Fatty acid content (mean mg kg −1 DW ± standard deviation) of Brassica seeds. C 16:0, palmitic acid; C 18:0, stearic acid; C 18:1, oleic acid; C 18:2, linoleic acid; C 18:3, linolenic acid; C 20:0, arachidic acid; C 20:1, gadoleic acid; C 22:0, beonic acid; C 22:1, erucic acid. T -FA, total fatty acids. Means within a column followed by the same letter do not differ significantly at P ≤ B1. B. rupestri
brevisiliqua) and in B8 (B. incana) was higher than in
the B1–B2 populations and in B9 (B. macrocarpa)
(Table II). As to α-, γ- and T-Toc content, the subspe-
cies B5 was not homogenous with the B3–B7 group C 18:3 173.73 ± 14.5 170.01 ± 13.7 217.27 ± 17.9 187.43 ± 15.1 175.87 ± 14.6 233.40 ± 16.5 169.03 ± 15.6 229.90 ± 18.4 169.38 ± 13.2
and was more similar to the B. rupestris group (Table
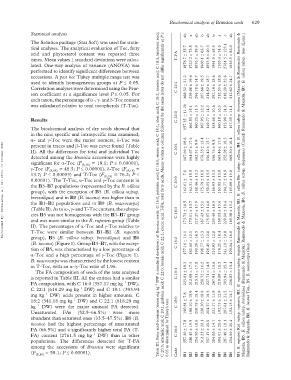
II). The percentages of α-Toc and γ-Toc relative to
T-Toc were similar between B1–B2 (B. rupestris
group), B5 (B. villosa subsp. brevisiliqua) and B8
(B. incana) (Figure 1). Group B3–B7, with the excep- C 18:2 177.16 ± 16.1 182.60 ± 12.1 190.29 ± 14.5 198.77 ± 13.3 198.45 ± 12.6 210.93 ± 12.8 174.21 ± 14.4 341.18 ± 19.8 190.34 ± 16.0
tion of B5, was characterised by a low percentage of
α-Toc and a high percentage of γ-Toc (Figure 1).
B. macrocarpa was characterised by the lowest content
in T-Toc, with an α-/γ-Toc ratio of 1.96.
The FA composition of seeds of the taxa analysed C 18:1 223.81 ± 19.3 212.08 ± 17.3 215.51 ± 17.8 258.72 ± 16.2 227.71 ± 14.9 267.91 ± 15.6 219.69 ± 16.5 393.94 ± 25.1 226.83 ± 15.4
Figure 1. Content of α-, γ- and δ-Toc (% relative to total Toc) in seeds of Brassica species and subspecies.
is reported in Table III. All the entities had a similar
−1
FA composition, with C 16:0 (357.17 mg kg DW),
−1
C 22:1 (618.29 mg kg DW) and C 18:1 (393.94
−1
mg kg DW) acids present in higher amounts. C
−1
18:2 (341.18 mg kg DW) and C 22:1 (618.29 mg C 18:0 190.81 ± 7.8 188.10 ± 15.9 210.79 ± 15.4 220.20 ± 18.8 214.57 ± 16.3 221.17 ± 11.9 192.73 ± 12.9 287.61 ± 21.5 192.13 ± 13.7 Raimondo & Mazzola, B8. B. incana Ten., B9. B. macrocarpa Guss.
−1
kg DW) were the major unusual FA detected.
Unsaturated FAs (52.5–66.5%) were more
abundant than saturated ones (33.5–47.5%). B8 (B.
incana) had the highest percentage of unsaturated
FA (66.5%) and a significantly higher total FA (T- 0.05 as determined by Tukey’s test. C 16:0 357.20 ± 17.8 248.42 ± 19.9 254.50 ± 18.6 312.23 ± 20.1 357.17 ± 21.9 284.00 ± 14.7 304.61 ± 20.4 287.49 ± 18.1 254.60 ± 21.4
−1
FA) content (2761.5 mg kg DW) than in other
populations. The differences detected for T-FA
among the accessions of Brassica were significant
(F (8,18) = 59.1; P ≤ 0.00001). Code B1 B2 B3 B4 B5 B6 B7 B8 B9