
Page 16 - Vannucchi_Cappietti_2016
P. 16
Sustainability 2016, 8, 1300 16 of 21
Sustainability 2016, 8, 1300 16 of 21
Sustainability 2016, 8, 1300 16 of 21
(a) (b)
(a) (b)
(c) (d)
(c) (d)
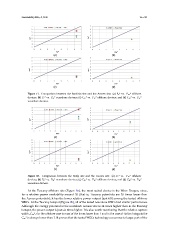
Figure 11. Comparison between the Sardinia site and the Azores site: (a) Pe* vs. Pw* offshore devices;
Figure 11. Comparison between the Sardinia site and the Azores site: (a) P e * vs. P w * offshore
Figure 11. Comparison between the Sardinia site and the Azores site: (a) Pe* vs. Pw* offshore devices;
(b) Pe* vs. Pw* nearshore devices; (c) Cw* vs. Pw* offshore devices; and (d) Cw* vs. Pw* nearshore
devices; (b) P e * vs. P w * nearshore devices; (c) C w * vs. P w * offshore devices; and (d) C w * vs. P w *
(b) Pe* vs. Pw* nearshore devices; (c) Cw* vs. Pw* offshore devices; and (d) Cw* vs. Pw* nearshore
devices.
nearshore devices.
devices.
(a) (b)
(a) (b)
(c) (d)
(c) (d)
Figure 12. Comparison between the Sicily site and the Azores site: (a) Pe* vs. Pw* offshore devices; (b)
Figure 12. Comparison between the Sicily site and the Azores site: (a) Pe* vs. Pw* offshore devices; (b)
Pe* vs. Pw* nearshore devices; (c) Cw* vs. Pw* offshore devices; and (d) Cw* vs. Pw* nearshore devices.
Figure 12. Comparison between the Sicily site and the Azores site: (a) P e * vs. P w * offshore
Pe* vs. Pw* nearshore devices; (c) Cw* vs. Pw* offshore devices; and (d) Cw* vs. Pw* nearshore devices.
devices; (b) P e * vs. P w * nearshore devices; (c) C w * vs. P w * offshore devices; and (d) C w * vs. P w *
At the Tuscany offshore site (Figure 9a), the most suited device is the Wave Dragon, since, for a
nearshore devices.
At the Tuscany offshore site (Figure 9a), the most suited device is the Wave Dragon, since, for a
relative power availability around 20 (that is, Tuscany potentials are 20 times lower than the Azores
relative power availability around 20 (that is, Tuscany potentials are 20 times lower than the Azores
potentials), it has the lower relative power output (just 6.8) among the tested offshore WECs. At the
At the Tuscany offshore site (Figure 9a), the most suited device is the Wave Dragon, since,
potentials), it has the lower relative power output (just 6.8) among the tested offshore WECs. At the
Tuscany hotspot (Figure 9b), all of the tested nearshore WECs had similar performance. Although
for a relative power availability around 20 (that is, Tuscany potentials are 20 times lower than
Tuscany hotspot (Figure 9b), all of the tested nearshore WECs had similar performance. Although
the energy potential at the nearshore oceanic site is 14 times higher than in the Tuscany hotspot, the
the Azores potentials), it has the lower relative power output (just 6.8) among the tested offshore
the energy potential at the nearshore oceanic site is 14 times higher than in the Tuscany hotspot, the
power output is just six times higher. It is also worth mentioning that the relative capture width, Cw*,
WECs. At the Tuscany hotspot (Figure 9b), all of the tested nearshore WECs had similar performance.
power output is just six times higher. It is also worth mentioning that the relative capture width, Cw*,
for the offshore case is most of the times lower than 1 and in the case of Italian hotspots the Cw* is
Although the energy potential at the nearshore oceanic site is 14 times higher than in the Tuscany
for the offshore case is most of the times lower than 1 and in the case of Italian hotspots the Cw* is
always lower than 1. It proves that the tested WECs technology can convert a larger part of the
hotspot, the power output is just six times higher. It is also worth mentioning that the relative capture
always lower than 1. It proves that the tested WECs technology can convert a larger part of the
Italian potentials than the EU oceanic site potentials. On the basis of this analysis, Table 6
width, C w *, for the offshore case is most of the times lower than 1 and in the case of Italian hotspots the
Italian potentials than the EU oceanic site potentials. On the basis of this analysis, Table 6
C w * is always lower than 1. It proves that the tested WECs technology can convert a larger part of the