
Page 11 - Vannucchi_Cappietti_2016
P. 11
Sustainability 2016, 8, 1300 11 of 21
Sustainability 2016, 8, 1300 11 of 21
Vicinanza et al. [33] studied the nearshore area along the NW of Sardinia. The nearshore
simulation was performed with the MIKE 21 NSW model that was forced with wave data measured at
Vicinanza et al. [33] studied the nearshore area along the NW of Sardinia. The nearshore
the Alghero wave buoy (period 1989–2009). They reported the wave power at seven coastal points and
simulation was performed with the MIKE 21 NSW model that was forced with wave data measured
found a largest value of 10.91 kW/m in front of Torre su Pittu bay (out of our domain).
at the Alghero wave buoy (period 1989–2009). They reported the wave power at seven coastal points
In the case of the nearshore area at Sicily Region, the area between San Vito lo Capo and
and found a largest value of 10.91 kW/m in front of Torre su Pittu bay (out of our domain).
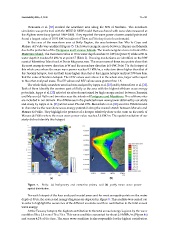
Mazara del Vallo was analyzed (Figure 7). The lowest energetic area is between Trapani and Marsala
In the case of the nearshore area at Sicily Region, the area between San Vito lo Capo and Mazara
due to the protection of the Favignana and Levanzo Islands. The most energetic area is in front of the
del Vallo was analyzed (Figure 7). The lowest energetic area is between Trapani and Marsala due to
Marettimo Island. The maximum value at 15 m water depth reaches 9.1 kW/m (point 7) while at 50 m
the protection of the Favignana and Levanzo Islands. The most energetic area is in front of the
Marettimo Island. The maximum value at 15 m water depth reaches 9.1 kW/m (point 7) while at 50 m
water depth it reaches 8.6 kW/m at point 17 (Table 2). Focusing mechanisms are identified on the NW
water depth it reaches 8.6 kW/m at point 17 (Table 2). Focusing mechanisms are identified on the
coast of Marettimo Island and at Punta Mugnone area. The wave roses of these two points show that
NW coast of Marettimo Island and at Punta Mugnone area. The wave roses of these two points show
the most energetic wave direction is W and the secondary direction is S-SW. Point 7 is the hotspot of
that the most energetic wave direction is W and the secondary direction is S-SW. Point 7 is the
this whole area where the mean wave power reaches 9.1 kW/m, a value two times higher than that of
hotspot of this whole area where the mean wave power reaches 9.1 kW/m, a value two times higher
the Tuscany hotspot, four and half times higher than that at the Liguria hotspot and just 20% less than
than that of the Tuscany hotspot, four and half times higher than that at the Liguria hotspot and just
that the value at Sardinia hotspot. The COV values were above 2 in the whole area, larger with respect
20% less than that the value at Sardinia hotspot. The COV values were above 2 in the whole area,
to the other analyzed areas. The SV values and MV values were greater than 1.5.
larger with respect to the other analyzed areas. The SV values and MV values were greater than 1.5.
The whole Sicily nearshore area has been analyzed by Iuppa et al. [23] and by Monteforte et al. [32].
The whole Sicily nearshore area has been analyzed by Iuppa et al. [23] and by Monteforte et al. [32].
Both of them identify the western part of Sicily as the area with the highest offshore wave energy
Both of them identify the western part of Sicily as the area with the highest offshore wave energy
potentials. Iuppa et al. [23] selected six sites characterized by high energy content between Terrasini
potentials. Iuppa et al. [23] selected six sites characterized by high energy content between Terrasini
and Mazara del Vallo and two sites near the islands of Favignana and Marettimo. Five of those sites
and Mazara del Vallo and two sites near the islands of Favignana and Marettimo. Five of those sites
are included in our domain. The differences in the predicted mean wave power obtained by our study
are included in our domain. The differences in the predicted mean wave power obtained by our
and study by Iuppa et al. [23] are between 2% and 19%. Monteforte et al. [32] used the SWAN model
study and study by Iuppa et al. [23] are between 2% and 19%. Monteforte et al. [32] used the SWAN
to characterize the nearshore wave energy potential along the coastal stretch between Marsala and
model to characterize the nearshore wave energy potential along the coastal stretch between Marsala
Mazara del Vallo. They highlight the presence of a hotspot relatively close to the coast on the north of
and Mazara del Vallo. They highlight the presence of a hotspot relatively close to the coast on the
Mazara del Vallo where the mean wave power value reaches 5.6 kW/m. The spatial resolution of our
north of Mazara del Vallo where the mean wave power value reaches 5.6 kW/m. The spatial
study did not identify this hotspot.
resolution of our study did not identify this hotspot.
(a) (b)
Figure 7. Sicily: (a) bathymetry and extraction points; and (b) yearly mean wave power spatial distribution.
Figure 7. Sicily: (a) bathymetry and extraction points; and (b) yearly mean wave power
spatial distribution.
For each hotspot of the four analyzed coastal areas and for most energetic points on the water
depth of 50 m, the scatter and energy diagrams are depicted in Figure 8. This analysis was carried
For each hotspot of the four analyzed coastal areas and for most energetic points on the water
out in order to highlight the occurrence of the different sea states and their contribution to the total
depth of 50 m, the scatter and energy diagrams are depicted in Figure 8. This analysis was carried out
annual wave energy.
in order to highlight the occurrence of the different sea states and their contribution to the total annual
At the Tuscany hotspot, the highest contribution to the total annual energy is given by the wave
wave energy.
condition Hs = 2.5 m and Te = 7.5 s. This wave condition accounted for about 2.9 MWh/m (Figure 8a)
At the Tuscany hotspot, the highest contribution to the total annual energy is given by the wave
and occurs 4.2% of the time. The same wave condition is also responsible for the highest contribution
condition Hs = 2.5 m and Te = 7.5 s. This wave condition accounted for about 2.9 MWh/m (Figure 8a)
to the total energy at the most energetic point in 50 m water depth (point 19), where it accounts for
and occurs 4.2% of the time. The same wave condition is also responsible for the highest contribution
about 2.5 MWh/m and occurs 3.5% of the time.