
Page 9 - Vannucchi_Cappietti_2016
P. 9
Sustainability 2016, 8, 1300 9 of 21
Sustainability 2016, 8, 1300 9 of 21
Sustainability 2016, 8, 1300 9 of 21
(a) (b)
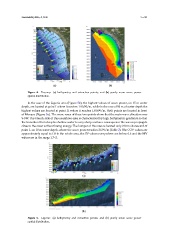
Figure 4. Tuscany: (a) bathymetry and extraction points; and (b) yearly mean wave power spatial distribution.
Figure 4. Tuscany: (a) bathymetry and extraction points; and (b) yearly mean wave power
(a) (b)
spatial distribution.
In the case of the Liguria area (Figure 5b), the highest values of wave power, on 15 m water
Figure 4. Tuscany: (a) bathymetry and extraction points; and (b) yearly mean wave power spatial distribution.
depth, are located at point 1 where it reaches 1.9 kW/m, while in the case of 50 m of water depth the
In the case of the Liguria area (Figure 5b), the highest values of wave power, on 15 m water
highest values are located at point 11 where it reaches 1.8 kW/m. Both points are located in front of
In the case of the Liguria area (Figure 5b), the highest values of wave power, on 15 m water
depth, are located at point 1 where it reaches 1.9 kW/m, while in the case of 50 m of water depth the
Monaco (Figure 5a). The wave roses of these two points show that the main wave direction was
depth, are located at point 1 where it reaches 1.9 kW/m, while in the case of 50 m of water depth the
S-SW. The French side of this nearshore area is characterized by high bathymetric gradients so that in front
highest values are located at point 11 where it reaches 1.8 kW/m. Both points are located
highest values are located at point 11 where it reaches 1.8 kW/m. Both points are located in front of
the transition from deep to shallow water is very sharp and as a consequence the waves propagate was
of Monaco (Figure 5a). The wave roses of these two points show that the main wave direction
Monaco (Figure 5a). The wave roses of these two points show that the main wave direction was
close to the coast without losing energy. The hotspot of this area is located only 210 m shoreward of
S-SW. The French side of this nearshore area is characterized by high bathymetric gradients so that
S-SW. The French side of this nearshore area is characterized by high bathymetric gradients so that
point 1, on 10 m water depth, where the wave power reaches 2 kW/m (Table 2). The COV values are
the transition from deep to shallow water is very sharp and as a consequence the waves propagate
the transition from deep to shallow water is very sharp and as a consequence the waves propagate
approximately equal to 1.8 in the whole area, the SV values everywhere are below 0.6 and the MV
close to the coast without losing energy. The hotspot of this area is located only 210 m shoreward of
close to the coast without losing energy. The hotspot of this area is located only 210 m shoreward of
values are in the range 1.7–2.
point 1, on 10 m water depth, where the wave power reaches 2 kW/m (Table 2). The COV values are
point 1, on 10 m water depth, where the wave power reaches 2 kW/m (Table 2). The COV values are
approximately equal to 1.8 in the whole area, the SV values everywhere are below 0.6 and the MV
approximately equal to 1.8 in the whole area, the SV values everywhere are below 0.6 and the MV
values are in the range 1.7–2.
values are in the range 1.7–2.
(a)
(a)
(b)
Figure 5. Liguria: (a) bathymetry and extraction points; and (b) yearly mean wave power spatial distribution.
(b)
Figure 5. Liguria: (a) bathymetry and extraction points; and (b) yearly mean wave power spatial distribution.
Figure 5. Liguria: (a) bathymetry and extraction points; and (b) yearly mean wave power
spatial distribution.