
Page 5 - Vannucchi_Cappietti_2016
P. 5
Sustainability 2016, 8, 1300 5 of 21
◦
◦
◦
◦
36.5 E of longitude and from 30 N to 46 N of latitude, with a resolution of 0.1 (that correspond to
about 11 km in latitude and 8 km in longitude). The validation of the wave hindcasting was done by
IFREMER on the basis of measurements from surface buoys and satellites [47]. The values of significant
wave height and energy period were used to compute the deep water wave power corresponding to
each sea state based on Equation (1): 5 of 21
Sustainability 2016, 8, 1300
36.5°E of longitude and from 30°N to 46°N of latitude, with a resolution of 0.1° (that correspond to
2
1 g
2
P w =
T
mo m−1,0 ,
ρH
about 11 km in latitude and 8 km in longitude). The validation of the wave hindcasting was done by (1)
64 π
IFREMER on the basis of measurements from surface buoys and satellites [47]. The values of
significant wave height and energy period were used to compute the deep water wave power
3
where ρ is the seawater density (1025 kg/m ) and g is the gravitational acceleration (9.81 m/s).
corresponding to each sea state based on Equation (1):
In addition, the yearly mean wave powers were computed in order to characterize the Mediterranean
1g 2 2
Sea (see Section 3). P w H T m 1,0 , (1)
mo
64
3.2. Assessment of the Nearshore Potential and Hotspots Identification
3
where is the seawater density (1025 kg/m ) and g is the gravitational acceleration (9.81 m/s). In
addition, the yearly mean wave powers were computed in order to characterize the Mediterranean
The processes affecting the waves during their propagation towards the coastline can modify
Sea (see Section 3).
the offshore wave energy potential values, leading to reductions, due to energy dissipation or local
3.2. Assessment of the Nearshore Potential and Hotspots Identification
enhancements due to focusing mechanisms. Numerical simulations were carried out to quantify these
The processes affecting the waves during their propagation towards the coastline can modify
processes using the Spectral Wave (SW) module of the MIKE21 software package [48]. The SW is a third
the offshore wave energy potential values, leading to reductions, due to energy dissipation or local
generation spectral wind–wave model based on unstructured mesh that allows the simulation of the
enhancements due to focusing mechanisms. Numerical simulations were carried out to quantify
non-linear wave–wave interaction, dissipation due to white-capping, dissipation due to bottom friction,
these processes using the Spectral Wave (SW) module of the MIKE21 software package [48]. The SW
dissipation due to depth-induced wave breaking, directional spreading, refraction and shoaling due to
is a third generation spectral wind–wave model based on unstructured mesh that allows the
simulation of the non-linear wave–wave interaction, dissipation due to white-capping, dissipation
depth variations.
due to bottom friction, dissipation due to depth-induced wave breaking, directional spreading,
Offshore boundary conditions for the SW models were obtained from the wave hindcasting data
refraction and shoaling due to depth variations.
of IFREMER–MED 6MIN model on water depths of about 100 m from June 2009 to December 2013.
Offshore boundary conditions for the SW models were obtained from the wave hindcasting
All 13,268 available values of significant wave height, peak period, mean wave direction and spreading
data of IFREMER–MED 6MIN model on water depths of about 100 m from June 2009 to December
2013. All 13,268 available values of significant wave height, peak period, mean wave direction and
factor were propagated with the fully spectral and quasi-stationary formulation. The JONSWAP fetch
spreading factor were propagated with the fully spectral and quasi-stationary formulation. The
growth expression was used as initial condition with the classical parameters (σ a = 0.07, σ = 0.09, γ = 3.3).
b
JONSWAP fetch growth expression was used as initial condition with the classical parameters (σa = 0.07,
Four nearshore areas were investigated (see Figure 1): the area between La Spezia and Livorno,
σb = 0.09, γ = 3.3).
called Tuscany (domain sizes about 30 km × 130 km); the area between Monaco (France) and Imperia,
Four nearshore areas were investigated (see Figure 1): the area between La Spezia and Livorno,
called Tuscany (domain sizes about 30 km × 130 km); the area between Monaco (France) and
here after called Liguria for brevity (domain sizes about 7 km × 75 km); the area between Stintino and
Imperia, here after called Liguria for brevity (domain sizes about 7 km × 75 km); the area between
Alghero, called Sardinia (domain sizes about 30 km × 70 km); and the area between San Vito Lo Capo
Stintino and Alghero, called Sardinia (domain sizes about 30 km × 70 km); and the area between San
and Mazara del Vallo, called Sicily (domain sizes about 65 km × 85 km).
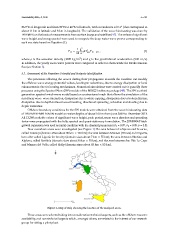
Vito Lo Capo and Mazara del Vallo, called Sicily (domain sizes about 65 km × 85 km).
Figure 1. Map of Italy showing the location of the analyzed areas.
Figure 1. Map of Italy showing the location of the analyzed areas.
These areas were selected taking into consideration technical aspects, such as the offshore resource
availability, and non-technical aspects which, amongst others, are related to the interest of our research
group for sitting a pilot plant.