
Page 10 - Vannucchi_Cappietti_2016
P. 10
Sustainability 2016, 8, 1300 10 of 21
Table 2. Location, mean wave power (Pw), COV, SV, and MV values related to the hotspots and the
Sustainability 2016, 8, 1300 10 of 21
most energetic points among those selected on water depths of 50 m of the four nearshore areas
investigated.
Table 2. Location, mean wave power (P w ), COV, SV, and MV values related to the hotspots and the most
Latitude (WGS84-UTM32) Longitude (WGS84-UTM32) Pw (kW/m) COV SV MV Water Depth (m)
energetic points among those selected on water depths of 50 m of the four nearshore areas investigated.
Tuscany
Latitude (WGS84-UTM32) Longitude (WGS84-UTM32) P w (kW/m) COV SV MV Water Depth (m)
4,826,801 592,648 4.7 1.87 0.99 2.03 −10
Tuscany
4,826,150 587,255 3.8 1.84 0.96 2.02 −50
4,826,801 592,648 4.7 1.87 0.99 2.03 −10
4,826,150 587,255 Liguria 3.8 1.84 0.96 2.02 −50
4,841,692 371,620 2 1.93 0.69 1.9 −10
Liguria
4,840,551 371,127 1.8 1.87 0.64 1.82 −50
4,841,692 371,620 2 1.93 0.69 1.9 −10
4,840,551 371,127 Sardinia 1.8 1.87 0.64 1.82 −50
4,509,652 426,722 Sardinia 11.4 2 1.49 1.72 −20
1.49 1.71
4,509,971
424,733
−20
4,509,652 426,722 11.4 11.7 2 2 1.49 1.72 −50
4,509,971 424,733 Sicily 11.7 2 1.49 1.71 −50
4,208,742 238,674 Sicily 9.1 2.58 1.76 2.03 −15
4,209,477
1.76 1.99
238,355
−15
4,208,742 238,674 9.1 8.6 2.58 2.55 1.76 2.03 −50
4,209,477 238,355 8.6 2.55 1.76 1.99 −50
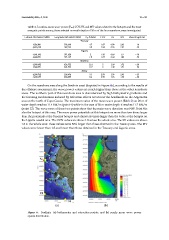
On the nearshore area along the Sardinia coast (depicted in Figure 6b), according to the results
On the nearshore area along the Sardinia coast (depicted in Figure 6b), according to the results of
of the offshore assessment, the wave power values are much higher than those at the other nearshore
the offshore assessment, the wave power values are much higher than those at the other nearshore
areas. The northern part of this nearshore area is characterized by high bathymetric gradients and
the focusing mechanisms induced by refraction effects occur near the headlands on the Argenteria
areas. The northern part of this nearshore area is characterized by high bathymetric gradients and
the focusing mechanisms induced by refraction effects occur near the headlands on the Argenteria
area on the north of Capo Caccia. The maximum value of the mean wave power (Table 2) on 20 m of
area on the north of Capo Caccia. The maximum value of the mean wave power (Table 2) on 20 m of
water depth reaches 11.4 kW/m (point 4) while in the case of 50 m water depth it reaches 11.7 kW/m
(point 12). The wave roses of these two points show that the main wave direction was NW. Point 4 is
water depth reaches 11.4 kW/m (point 4) while in the case of 50 m water depth it reaches 11.7 kW/m
(point 12). The wave roses of these two points show that the main wave direction was NW. Point 4 is
also the hotspot of this area. The wave power potentials at this hotspot are more than two times
also the hotspot of this area. The wave power potentials at this hotspot are more than two times larger
larger than the potentials at the Tuscany hotspot and almost six times larger than the value at the
hotspot on the Liguria coastal area. The COV values are above 1.8 across the whole area. The SV
than the potentials at the Tuscany hotspot and almost six times larger than the value at the hotspot on
values are above 1.3 in the whole area: these values were 50% larger than those obtained in the
the Liguria coastal area. The COV values are above 1.8 across the whole area. The SV values are above
Tuscany area. The MV values were lower than 1.8 and lower than those obtained in the Tuscany and
1.3 in the whole area: these values were 50% larger than those obtained in the Tuscany area. The MV
Liguria areas.
values were lower than 1.8 and lower than those obtained in the Tuscany and Liguria areas.
(a) (b)
Figure 6. Sardinia: (a) bathymetry and extraction points; and (b) yearly mean wave power spatial distribution.
Figure 6. Sardinia: (a) bathymetry and extraction points; and (b) yearly mean wave power
spatial distribution.