
Page 13 - Vannucchi_Cappietti_2016
P. 13
Sustainability 2016, 8, 1300 13 of 21
Sustainability 2016, 8, 1300 13 of 21
SICILY
(g) (h)
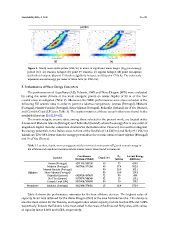
Figure 8. Yearly mean wave power (kW/m) in terms of significant wave height (Hm0) and energy
Figure 8. Yearly mean wave power (kW/m) in terms of significant wave height (H m0 ) and energy
period (Te): (a) Tuscany hotspot; (b) point 19 Tuscany; (c) Liguria hotspot; (d) point 14 Liguria; (e)
period (Te): (a) Tuscany hotspot; (b) point 19 Tuscany; (c) Liguria hotspot; (d) point 14 Liguria;
Sardinia hotspot; (f) point 12 Sardinia; (g) Sicily hotspot; and (h) point 17 Sicily. The color scale
(e) Sardinia hotspot; (f) point 12 Sardinia; (g) Sicily hotspot; and (h) point 17 Sicily. The color scale
represents annual energy per meter of wave front (in KWh/m).
represents annual energy per meter of wave front (in KWh/m).
5. Performances of Wave Energy Converters
5. Performances of Wave Energy Converters
The performances of AquaBuoy (AB), Pelamis, AWS and Wave Dragon (WD) were evaluated
by using the wave climate at the most energetic points on water depths of 50 m of the four coastal
The performances of AquaBuoy (AB), Pelamis, AWS and Wave Dragon (WD) were evaluated
areas investigated (Table 2). Moreover, the WEC performances were also evaluated at the following
by using the wave climate at the most energetic points on water depths of 50 m of the four
EU oceanic sites in order to permit a relative comparison: Azores (Portugal), Madeira (Portugal),
coastal areas investigated (Table 2). Moreover, the WEC performances were also evaluated at the
Nazarè-Peniche (Portugal), Sines-Aljezur (Portugal), Belmullet (Ireland), Ile d’Yeu (France), and
following EU oceanic sites in order to permit a relative comparison: Azores (Portugal), Madeira
Cornish Coast (UK) (see Table 3). The scatter matrices of these oceanic sites were found in the
(Portugal), Nazarè-Peniche (Portugal), Sines-Aljezur (Portugal), Belmullet (Ireland), Ile d’Yeu (France),
available literature [29,42,59–62].
and Cornish Coast (UK) (see Table 3). The scatter matrices of these oceanic sites were found in the
The most energetic oceanic sites, among those selected in the present work, are located at the
available literature [29,42,59–62].
Azores and Madeira Islands (Portugal) and Belmullet (Ireland) where the energy flux is one order of
magnitude higher than the values that characterize the Italian areas. However, it is worth noting that at the
The most energetic oceanic sites, among those selected in the present work, are located
the energy potentials in the Italian areas in front of the Sardinia (11.4 kW/m) and Sicily (9.1 kW/m)
Azores and Madeira Islands (Portugal) and Belmullet (Ireland) where the energy flux is one order of
islands are 22%–38% lower than the energy potentials in the oceanic areas at Sines-Aljezur (Portugal)
magnitude higher than the values that characterize the Italian areas. However, it is worth noting that
and Ile d’Yeu (France).
the energy potentials in the Italian areas in front of the Sardinia (11.4 kW/m) and Sicily (9.1 kW/m)
islands are 22%–38% lower than the energy potentials in the oceanic areas at Sines-Aljezur (Portugal)
Table 3. Location, depth, wave energy potentials in terms of mean power (Pw) and annual energy in
and Ile d’Yeu (France).
the offshore and nearshore locations whose scatter matrix were found in literature.
Annual Energy
Coordinates Pw ) and annual energy in
Table 3. Location, depth, wave energy potentials in terms of mean power (P w
Depth (m)
Location
(kW/m)
(WGS84-UTM32)
the offshore and nearshore locations whose scatter matrix were found in literature. (MWh/m)
Azores (Portugal) 4291193/385315 43 73 639.5
502.8
Madeira (Portugal) 3667766/371286 40 57.4 P w Annual Energy
Coordinates
Location Depth (m)
Nazarè-Peniche (Portugal) (WGS84-UTM32) 50 20.8 (kW/m) 182.1
-
(MWh/m)
Offshore Sines-Aljezur (Portugal) - 50 14.8 129.3
Azores (Portugal) 4291193/385315 43 73 639.5
Belmullet (Ireland) 6028028/497403 72 50 438
Madeira (Portugal) 3667766/371286 40 57.4 502.8
Ile d’Yeu (France)
Nazarè-Peniche (Portugal) 5170879/544349 32 50 15 20.8 113.1
182.1
-
129.3
Sines-Aljezur (Portugal)
-
Offshore Cornish Coast (UK) 5576508/309895 50 50 20 14.8 175.2
Nearshore Madeira (Portugal) 3663184/374026 15 72 65.4 50 572.9 438
Belmullet (Ireland)
6028028/497403
Ile d’Yeu (France) 5170879/544349 32 15 113.1
20
5576508/309895
175.2
Table 4 shows the performance estimates for the four offshore devices. The highest value of
Cornish Coast (UK)
50
capacity factor was obtained for the Wave Dragon (WD) at the area Nazarè-Peniche. This device is
Nearshore Madeira (Portugal) 3663184/374026 15 65.4 572.9
also the most suited for the Tuscany and Liguria sites where capacity factors reach 4.15% and 3.24%
respectively. Instead, the Pelamis is the most suited in the cases of Sardinia and Sicily sites, with
Table 4 shows the performance estimates for the four offshore devices. The highest value of
values of capacity factor 8.66% and 6.54%, respectively.
capacity factor was obtained for the Wave Dragon (WD) at the area Nazarè-Peniche. This device is
also the most suited for the Tuscany and Liguria sites where capacity factors reach 4.15% and 3.24%
respectively. Instead, the Pelamis is the most suited in the cases of Sardinia and Sicily sites, with values
of capacity factor 8.66% and 6.54%, respectively.