
Page 8 - Vannucchi_Cappietti_2016
P. 8
Sustainability 2016, 8, 1300 8 of 21
P(kW)
(8)
Sustainability 2016, 8, 1300 c= e [ ]m 8 of 21
w
P(kW / m)
w
The performances of AquaBuoy, Pelamis, AWS and Wave Dragon were evaluated in the most
The performances of AquaBuoy, Pelamis, AWS and Wave Dragon were evaluated in the most
energetic points on the 50 m water depth between those selected in this work and compared with
energetic points on the 50 m water depth between those selected in this work and compared with
seven EU oceanic offshore locations whose scatter matrix were available in the open literature. These
seven EU oceanic offshore locations whose scatter matrix were available in the open literature.
locations are: São Jorge in Azores Island [59], Madeira Island [29], Nazarè-Peniche and Sines-Aljezur in
These locations are: São Jorge in Azores Island [59], Madeira Island [29], Nazarè-Peniche and
Portugal [42], Belmullet in Ireland [60], Ile d’Yeu in France [61], and Cornish Coast in United Kingdom
Sines-Aljezur in Portugal [42], Belmullet in Ireland [60], Ile d’Yeu in France [61], and Cornish Coast in
[62].
United Kingdom [62].
The performances of the Oyster and Wave Star were evaluated in the four nearshore hotspots
The performances of the Oyster and Wave Star were evaluated in the four nearshore hotspots and
and compared with the nearshore location at Madeira Island [29].
compared with the nearshore location at Madeira Island [29].
4. Wave Energy Assessments
4. Wave Energy Assessments
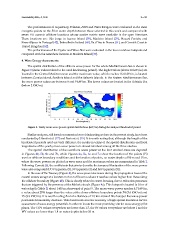
The spatial distribution of the offshore wave power for the whole Mediterranean Sea is shown
The spatial distribution of the offshore wave power for the whole Mediterranean Sea is shown in
in Figure 3 (mean values related to the used hindcasting period). The higher values (above 10 kW/m)
Figure 3 (mean values related to the used hindcasting period). The higher values (above 10 kW/m) are
are located in the Central Mediterranean and the maximum value, which reaches 16.4 kW/m, is
located in the Central Mediterranean and the maximum value, which reaches 16.4 kW/m, is located
located between Corsica Island, Sardinia Island and the Balearic Islands. In the Eastern
between Corsica Island, Sardinia Island and the Balearic Islands. In the Eastern Mediterranean Sea,
Mediterranean Sea, the wave power values are between 6 and 9 kW/m. The lower values are located
the wave power values are between 6 and 9 kW/m. The lower values are located in the Adriatic Sea
in the Adriatic Sea (below 2 kW/m).
(below 2 kW/m).
Figure 3. Yearly mean wave power spatial distributions (kW/m) during the analyzed hindcasted period.
Figure 3. Yearly mean wave power spatial distributions (kW/m) during the analyzed hindcasted period.
Similar analyses, still based on numerical wave hindcasting as done in the present study, have
Similar analyses, still based on numerical wave hindcasting as done in the present study, have been
been conducted by Liberti et al. [17] and Besio et al. [19]. It is worth noting that, although the length
conducted by Liberti et al. [17] and Besio et al. [19]. It is worth noting that, although the length of the
of the hindcasted periods used are very different, the results in terms of the spatial distribution and
hindcasted periods used are very different, the results in terms of the spatial distribution and local
local magnitudes of the yearly mean wave power are almost identical among all the three studies.
magnitudes of the yearly mean wave power are almost identical among all the three studies.
The spatial distribution of the nearshore wave power at the four studied areas are depicted in
The spatial distribution of the nearshore wave power at the four studied areas are depicted
Figures 4b, 5b, 6b and 7b, while Figures 4a, 5a, 6a and 7a show the location of the points (Pi) used as
in Figures 4b, 5b, 6b and 7b, while Figures 4a, 5a, 6a and 7a show the location of the points (Pi)
offshore boundary conditions and the location of points, on water depths of 50 m and 15 m, where the
used as offshore boundary conditions and the location of points, on water depths of 50 m and 15 m,
wave powers are plotted as wave roses and the maximum values are summarized in Table 2. Following
where the wave powers are plotted as wave roses and the maximum values are summarized in Table 2.
Cornett [6], the coefficients that aim to describe the temporal fluctuation of the wave power were
Following Cornett [6], the coefficients that aim to describe the temporal fluctuation of the wave power
also computed (COV Equation (3), SV Equation (4) and MV Equation (5)).
were also computed (COV Equation (3), SV Equation (4) and MV Equation (5)).
In the case of the Tuscany (Figure 4), the wave power decreases during the propagation toward
In the case of the Tuscany (Figure 4), the wave power decreases during the propagation toward the
the coastal waters except at a location in front of Livorno where it reaches values higher than those
coastal waters except at a location in front of Livorno where it reaches values higher than those along
along the offshore boundary (Figure 4b). This is clearly related to wave focusing due to refraction
the offshore boundary (Figure 4b). This is clearly related to wave focusing due to refraction processes
processes that are triggered by the presence of the Meloria shoals (Figure 4a). This hotspot is located
that are triggered by the presence of the Meloria shoals (Figure 4a). This hotspot is located in 10 m of
in 10 m of water depth (Table 2) about 1400 m shoreward of point 9. The mean wave power reaches
water depth (Table 2) about 1400 m shoreward of point 9. The mean wave power reaches 4.7 kW/m,
4.7 kW/m, a value about 25% larger than the value at the closer offshore boundary points P4 (3.6
a value about 25% larger than the value at the closer offshore boundary points P4 (3.6 kW/m) and
kW/m) and P5 (3.9 kW/m). It is worth noting that at a distance of 1.5 km around this hotspot the
P5 (3.9 kW/m). It is worth noting that at a distance of 1.5 km around this hotspot the wave power
wave power potentials dramatically decrease. This result motivates the necessity of high spatial
potentials dramatically decrease. This result motivates the necessity of high spatial resolution for the
resolution for the assessment of wave energy potentials in order to locate the most promising site for
assessment of wave energy potentials in order to locate the most promising site for wave energy pilot
wave energy pilot plants. The COV values everywhere are lower than 1.7, the SV values everywhere
plants. The COV values everywhere are lower than 1.7, the SV values everywhere are below 1 and the
are below 1 and the MV values are lower than 1.8 on water depths below 20 m.
MV values are lower than 1.8 on water depths below 20 m.