
Page 14 - Vannucchi_Cappietti_2016
P. 14
Sustainability 2016, 8, 1300 14 of 21
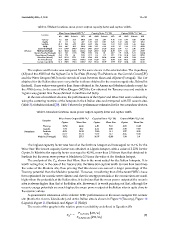
Table 4. Offshore locations: mean power output, capacity factor and capture width.
Mean Power Output (kW) “P e ” Capacity Factor “C f ” (%) Capture Width “C w ” (m)
Location
AB AWS Pelamis WD AB AWS Pelamis WD AB AWS Pelamis WD
Tuscany 7.3 26.5 21.5 290.6 2.93 1.32 2.87 4.15 1.93 6.97 5.66 76.48
Liguria 3.1 7.3 6.6 227 1.33 0.37 0.87 3.24 1.72 4.04 3.67 126.1
Sardinia 21.1 99.2 64.9 540.4 8.44 4.96 8.66 7.72 1.81 8.49 5.56 46.26
Sicily 14.5 64.7 49.1 419.4 5.81 3.23 6.54 5.99 1.7 7.55 5.73 48.99
Azores (Portugal) 77.3 539.9 208.8 1967.5 29.97 26.69 27.83 28.11 1.06 7.4 2.86 26.95
Offshore Madeira (Portugal) 45.5 413.8 118.6 1153.1 16.39 20.69 15.81 16.47 0.79 7.21 2.07 20.09
Nazarè-Peniche (Portugal) 56.1 292 112.5 2779 22.44 14.6 15 39.7 2.7 14.05 5.41 133.69
Sines-Aljezur (Portugal) 43.5 228 84 2324 17.4 11.4 11.2 33.2 2.95 15.44 5.69 157.41
Belmullet (Ireland) 90.7 515.9 277.1 2159 37.96 25.8 36.94 30.84 1.81 10.32 5.54 43.18
Ile d’Yeu (France) 53.2 367.9 120.8 1289.6 21.29 18.39 16.11 18.42 3.56 24.61 8.08 86.26
Cornish Coast (UK) 51.3 250.9 172.3 1243.7 23.7 12.54 22.97 17.77 2.57 12.54 8.62 62.18
The capture width index was compared for the same device in the selected sites. The AquaBuoy
(AB) and the AWS had the highest Cw in Ile d’Yeu (France), The Pelamis on the Cornish Coast (UK)
and the Wave Dragon (WD) on the stretch of coast between Sines and Aljezur (Portugal). The Cw
obtained for the Italian sites were very similar to those obtained in the most energetic site, Belmullet
(Ireland). These values were greater than those obtained in the Azores and Madeira Islands except for
the AWS device. In the case of Wave Dragon (WD) the Cw obtained for Tuscany area and mainly in
Liguria was greater than those obtained in Sardinia and Sicily.
In the case of nearshore devices, the performances of the Oyster and Wave Star were evaluated by
using the scattering matrices of the hotspots in the 4 Italian sites and compared with EU oceanic sites
(Table 3) at Madeira Island [29]. Table 5 shows the performance estimates for the two nearshore devices.
Table 5. Nearshore locations: mean power output, capacity factor and capture width.
Mean Power Output (kW) “P e ” Capacity Factor “C f ” (%) Capture Width “C w ” (m)
Location
Oyster Wave Star Oyster Wave Star Oyster Wave Star
Tuscany 22.59 46.86 6.45 7.81 4.85 10.05
Liguria 7.76 18.5 2.22 3.08 3.98 9.49
Nearshore Sardinia 48.51 96.59 13.86 16.1 4.27 8.49
Sicily 41.72 91.23 11.92 15.2 4.56 9.98
Madeira (Portugal) 129.2 257.3 36.97 42.88 1.98 3.9
The highest capacity factor was found at the Sardinia hotspot and was equal to 16.1% for the
Wave Star. The lowest capacity factor was obtained at Liguria hotspot, with a value of 2.22% for the
Oyster. In Madeira the capacity factor was equal to 42.9%, more than 2.5 times than that obtained in
Sardinia but the mean wave power at Madeira is 5.5 times the value at the Sardinia hotspot.
The analysis of the C w shows that Wave Star is the most suited for the Italian hotspots. It is
worth noting that, in the case of the Tuscany site, the Wave Star capture width is more than two times
the value at the Madeira site, thus proving that this device can convert a larger percentage of the
Tuscany potential than the Madeira potential. However, considering that all the tested WECs have
been optimized for oceanic wave climate and that the energy potentials at the oceanic sites are much
higher than the potentials at the Italian sites, it is obvious that the mean power output at the oceanic
sites is always higher than that at the Italian site. However, it is worth pointing out that, although the
oceanic energy potentials are much higher, the mean power output at the Italian sites is quite close to
the oceanic values.
A quantitative estimation of the relative WEC performances at the most energetic EU oceanic
site (that is the Azores Islands site) and at the Italian sites is shown in Figure 9 (Tuscany), Figure 10
(Liguria), Figure 11 (Sardinia), and Figure 12 (Sicily).
The x-axis of the graphs is the relative power availability as defined in Equation (9):
P w,Azores [kW/m]
∗
P w = (9)
P w,Italian site [kW/m]