
Page 21 - angeo-21-299-2003
P. 21
R. Sorgente et al.: Seasonal variability in the Central Mediterranean Sea circulation 319
(a)A) (b)B)
2.4 3
2.2 2.5
22
1.8
1.5
1.6
1
1.4
0.5
1.2
0
1
Sv
Watt
0.8 −0.5
0 0.5 1 1.5 2 2.5 3 3.5 4 4.5 5 0 0.5 1 1.5 2 2.5 3 3.5 4 4.5 5
(c) C)
−0.7
−0.8
−0.9
−1
psu m3/s −1.1
−1.2
−1.3
−1.4
−1.5
−1.6
0 0.5 1 1.5 2 2.5 3 3.5 4 4.5 5
Time (year)
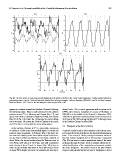
Fig. 20. The time series of mass, heat and salt transports at the Strait of Sicily for the 5-year model integration. Positive values indicate an
eastward transport. Panel a: Total and baroclinic (dashed line) volume transports. Units are Sverdrup (106m3/s). Panel b: Net heat transport.
Units are Watts × 1013. Panel c: Net salt transport. Units are psu·m3/s × 106.
appears to continue toward the Sardinia Channel following about 8 cm/s. This is not in agreement with Bouzinac et al.
the Sardinian slope. This is well evidenced by the salinity (1999), who found a maximum in excess of 38.68 psu at
sections across 9◦ E in February and August (Fig. 14), and 300–500 m in the middle of the Channel in November 1993,
agrees with what is reported by Hopkins (1988), who asserts while Murru (personal communication) found a maximum at
that 1/2 of the LIW enters the Tyrrhenian Sea recirculating 38.67 psu at 500–600 m along Sardinia at 9◦ E during a cruise
out to the south, 1/4 crosses the Corsica Channel in the north, in the Sardinia Channel in May 2000.
and 1/4 is lost in mixing with the surrounding waters.
4.5 Transports at the Strait of Sicily
In the Sardinia Channel, at 9◦ E, a layer with a maximum
of salinity is visible at the intermediate depth. Its width and A specific model result of direct interest is the volume trans-
position varies seasonally. In February (Fig. 14a), there are port across the Strait of Sicily into the Eastern Mediterranean
two maxima of salinity at the intermediate depth in the Chan- basin. Time series of 10-day averaged simulated values of
nel; the first is saltier and situated in the North, centered at the total volume transport and of its baroclinic component
about 700 m; the second resides along the Tunisian coast at (Fig. 20a) are used to make a quantitative study of the water
over 600 m with values of 38.57 psu, and with a simulated exchange through the Strait. Such an analysis allows the de-
total velocity of about 5 cm/s. In August (Fig. 14b), there is tailed identification of the magnitude and seasonal variabil-
only a deeper salinity maximum of 38.58 psu along Tunisia ity of the transports. The annual mean of the total volume
at about 700 m depth, and with a simulated total velocity of tranport computed during the last year of integration is about