
Page 19 - angeo-21-299-2003
P. 19
R. Sorgente et al.: Seasonal variability in the Central Mediterranean Sea circulation 317
38.5 (a)A)
16.5 17
38 18
North Latitude 16.5 18 15 18 17
19.5
37.5 18 15.5
18.5
37 19.5 16 18.5
18.5 15.5 16
36.5 17.5
19
36
19 18 16.5
35.5
11 11.5 12 12.5 13 13.5 14 14.5 15 15.5 16
East Longitude
(b)B)
38.5
38 0.5 m/s
37.5
North Latitude 37
36.5
36
35.5
11 11.5 12 12.5 13 13.5 14 14.5 15 15.5 16
East Longitude
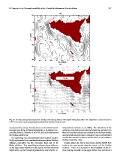
Fig. 18. Ten-day averaged (a) temperature and (b) total velocity fields at 30 m depth during September. The temperature contour interval is
0.5◦C. One vector every two grid points is plotted for velocity. Units are m/s.
accompanied by strong velocity shears in the bottom bound- tivity (Garcia Lafuente et al., 2002). The inclination of the
ary layer and along its lateral boundaries as it extends hori- isotherms (not shown) indicates that upwelling persists from
zontally down to a latitude of 36.4◦ N, and vertically beyond May to December, being most evident in the summer months
the Sicilian shelf break. and early fall when the water column becomes well stratified
and the thermocline is able to surface close to the southern
The upwelling zone runs along the whole southern coast of Sicilian coast (Fig. 18a).
Sicily and extends for a considerable distance (about 100 km)
offshore, especially over the Adventure Bank and on the During winter, the AIS is less intense and the MAW flow
Malta platform. This upwelling produces a large influence tends to be more spread along the interior of the Sicilian
on the upper layer dynamics in the region and has important Channel. There is a decrease in the amplitude of the in-
implications on the biological productivity and fisheries ac- tense looping meander in the upper Ionian Sea, and the exit