Page 14 - angeo-21-299-2003
P. 14

312 R. Sorgente et al.: Seasonal variability in the Central Mediterranean Sea circulation

            37.3  37.6 37.8             (a) A)                                              37.9
−200                                                                                  38.2
−400                                  37.65                                           38.5
−600
                                 38
                             38.4

                               38.52
                                      38.53
                             38.56
Depth (m.)
                                                                38.55                                   38.58
                                                                               38.56
−800

                                                                                      38.55
−1000                               38.53
−1200                               38.5 38.51
−1400

−1600
      37.2 37.4 37.6 37.8 38 38.2 38.4 38.6 38.8 39 39.2
                                                                   North Latitude

                                                               (b) B)

          37.25   37.8 37.9                                        38.57                                       38
−200                         3837.5
−400                        38.2                                       37.95
−600
                           38.51                                                                        38.1

                                                               38.4 38.3

                                                                                      38.5

                                                               38.54

Depth (m.)
                                                                                                 38.58
 −800                                     38.55
−1000                               38.53                                             38.54
−1200                                                                                 38.51
−1400                                         38.5

−1600
      37.2 37.4 37.6 37.8 38 38.2 38.4 38.6 38.8 39 39.2
                                                                   North Latitude

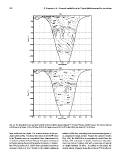
Fig. 14. The simulated 10-day averaged vertical section of salinity along longitude 9◦ E in (a) February and (b) August. The contour interval
is 0.05 psu in the range 37.0 to 38.5 psu, 0.01 in the range between 38.0 to 38.5 and 0.02 in the range 38.5 to 38.6 psu.

layer width and core depth. The vertical sections of the sim-  situated at 800 dbar, indicating flow characteristics typical of
ulated salinity (Fig. 14a) show the inflow of the MAW close     an alongshore frontal current. Toward the summer months
to the Tunisian coast, as a superficial layer characterized by  (Fig. 14b), the MAW flow is progressively eroded from the
a minimum salinity of about 37.2 psu and speeds reaching up    surface, with a decrease in speeds, becoming a subsurface
to 45 cm/s during the period November to March. In Novem-      core from July to October, and with a minimum of salinity
ber 1993, Bouzinac et al. (1999) have calculated a maximum     at a depth between 50–80 m. According to the model, the
eastward velocity of over 30 cm/s at the salinity minimum      eastern volume transport along the section at 9◦ E reaches its
   9   10   11   12   13   14   15   16   17   18   19