Page 15 - angeo-21-299-2003
P. 15

R. Sorgente et al.: Seasonal variability in the Central Mediterranean Sea circulation                                                                            313
                                                                                  (a) A)

                  37.5                     37.7                                                                              38.637.5
                        37.7                                                  37.5                                                                37.7
            −100
            −200              38.1               37.9                                                                                        37.9
            −300              38.5  38.3                                                                                                     38.1

                                             38.6                                                                                               38.3
Depth (m.)
                                          38.78 38.76 38.72−40038.74                                                                              38.5
            −500                                                                                                                                     38.6
                                                                     38.7 38.5

            −600  35.5 36 36.5 37 37.5                                                      38 38.5 39 39.5
                                                                  North Latitude
            −100
            −200                                                                    (b) B)
            −300
            −400                       37.6                                   37.4                                                     37.6                37.8
                              37.5 37.6 37.5                                                                                                            37.7

                              37.7                                                    38                                         37.8        37.9
                                            37.9
                                                       38.1                   38.2  38.5
                                                                                     38.7
                                   38.3                                                                                          38.2 38.1
                                                       38.5
Depth (m.)                                                                                                                                              38.3
                                      38.7

                                    38.74

                                                                                                                                                        38.5

                                    38.78

            −500                    38.8

                                                                                                                                       38.7
                                                                                                                                              38.72

            −600
                            35.5 36 36.5 37 37.5 38 38.5 39 39.5
                                                                             North Latitude

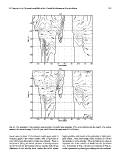
Fig. 15. The simulated 10-day averaged vertical section of salinity along longitude 13◦ E in (a) February and (b) August. The contour
interval is 0.1 psu in the range 37.4 to 38.7 psu, and 0.02 psu in the range from 38.7 to 38.8 psu.

lowest value of about 2.5 Sv between July/August, while it                                 highly unstable, and results in the generation of rather ener-
increases again in the winter months, with a maximum of                                    getic eddies. These have length scales of about 50–100 km
over 2.0 Sv from November to May (not shown). Prior to                                     and periods of a few months. They are believed to play an
the Strait of Sicily, the lateral variation in density between                             important role in the transfer of MAW into the Tyrrhenian
the MAW and the surrounding waters, together with strong                                   Sea. Krivosheya (1983), Astraldi and Gasparini (1994) de-
differences in the velocity shear, renders the MAW stream                                  scribe a permanent cyclonic gyre rotating over the southeast-
   10   11   12   13   14   15   16   17   18   19   20